Download
1 / 34
340 likes | 436 Views
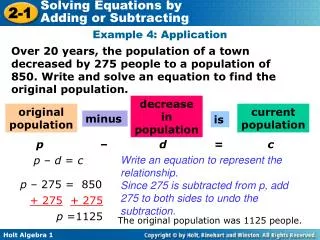
Develops an atlas for population-based DTI analysis, helping to map populations into common coordinate space, understand normal variability, and describe differences. Utilizes mathematical spatial transformations and atlas-based tractography.

E N D
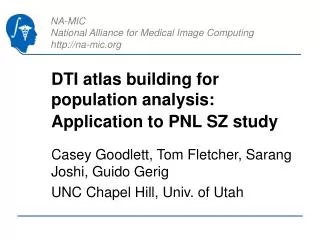
DTI atlas building for population analysis: Application to PNL SZ study Casey Goodlett, Tom Fletcher, Sarang Joshi, Guido Gerig UNC Chapel Hill, Univ. of Utah
Building of Population Averages • Motivation: • Map population into common coordinate space • Learn about normal variability • Describe difference from normal • Use as normative atlas for segmentation Sarang Joshi, Brad Davis, Matthieu Jomier, Guido Gerig, Unbiased Diffeomorphic Atlas Construction for Computational Anatomy, vol. 23, NeuroImage 2004 B. Avants and J.C. Gee, “Geodesic estimation for large deformation anatomical shape averaging and interpolation,” Neuroimage, vol. 23, pp. 139–150, 2004.
Population-Based DTI Analysis Casey Goodlett, MICCAI’06
Registration Atlas (Affine, Fluid) Structural Operator Structural Average DTI Images (1:N) Scalar Images From Manifold Detector on FA H-fields (1:N) H-1-fields (1:N)
Atlas formation DTI Images Rotate Tensors based on JH-1 Tensor Averaging DTI Atlas H-fields (1:N) Riemannian Symmetric Space
Structural Image • Want images aligned by geometry of fiber tracts • FA occurs in thin manifolds • sheets • tubes • FA'' highlights fiber geometry (maximum eigenvalue) • FA'' does not directly optimize correspondence of tensor derived property
Mathematics of Spatial Transformation h(x) is a mapping from R3 to R3. h(x) can be locally approximated as a linear function. F is the local Jacobian of the transformation and can be processed the same as for a global transformation. SVD can be used to extract the rotation component of F.
Processing of DTI • Diffusion tensors are symmetric positive-definite matrices • Riemannian symmetric spaces (Fletcher, Pennec) • Log-Euclidean Framework
Atlas: Average + Set of transformed tensor fields ROIs and tracts in atlas space transferred to every image.
Atlas-Based Tractography Image A Image B Atlas
PNL Data: Colored FA and MD Average of Control Group (N=13) FA MD Average of SZ Group (N=12) FA MD
Full Brain Tractography on Atlas MedINRIA Tool (Pierre Fillard, INRIA) NEW: NAMIC compatible: Reads NRRD format and writes NAMIC fiber format output, is promoted together with NAMIC FiberViewer tool.
Tractography in PNL Atlas Cingulum full Corpus Callosum middle part Cingulum “spine”
ant post more tracts… Uncinate Fasciculus UF colored with FA
Tractography per Group Cingulum SZ Group Cingulum Control Group Tractography applied to tensor fields of the set of controls mapped to the atlas (left) ad the set of SZ mapped to the atlas (right).
Very, very preliminary tests … SZ seems to have lower FA in middle portion of cingulum. What does it mean w.r.t. diffusion properties?
ctd. SZ group seems to have lower lambda1 and slightly higher radial diffusion (average lambda2 + lambda3) in middle region.
ctd. MD seems very similar for both groups. GA shows same pattern as FA but much higher values.
same game with cc … Middle cc in central region shows decrease of FA and increase of MD for SZ group
and with uncinate fasciculus Maybe no group difference.
Voxel-based Analysis: FA axial low axial high Control Atlas SZ Atlas Difference Can we trust these difference maps? Do we see residuum of deformation or FA difference?
Voxel-based Analysis: MD axial low axial high Controls SZ Difference Mismatch of two atlases illustrates a problem of our atlas building: Edges of structures not well-aligned.
Problem: What is a good image match feature? Features from tensor field driving nonlinear registration?
Image match should consider boundaries and tract locations Maxev FA MD Maxev FA MD
Towards improved image match features • MD does not show underlying wm structure • FA shows strong wm features but not anatomical boundaries • FA’’ (Hessian) emphasizes center lines • → Would like measure derived from full tensor field Thick and thin structures show similar center features
Hessian of tensor field? • Each element is matrix • Choice of Norm?
Hessian of Tensor Field • max_ev: maximum eigenvalue of each element • norm: norm of each element • tensor_ev:SIAM* *Lathauwer, SIAM J. MATRIX ANAL. APPL. Vol. 21, No. 4, pp. 1253–1278 3x3x(3x3) = 3*27elements
Current Work: Towards better image match features Collaboration with Fillard/Pennec, INRIA Second derivative of tensor field (1st ev of Hessian) tensor_ev max_ev norm tensor_ev max_ev norm
Conclusions • Core methods: Nonlinear deformation (diffeomorphic) and “good” feature maps • Atlas-building will require Slicer-3 “pipeline” (currently Linux script) • After automatic construction of atlas with set of deformed tensor fields: • Efficient, user-guided analysis (15’ per tract or region) • Full set of measurements (FA, GA, MD, lambda1..3, radial diffusion etc.) • Current research: Image match features • Set of tracts with associated tensors from aligned images: Ready for tensor statistics (Fletcher, e.g.)
Conclusion PNL DTI study • Low hanging fruits were not as low as expected … • What was promised for Christmas is available now • Encouraging results on multiple key structures (cc, UF, cingulum, fornix etc.) • Plan for programmer’s week: To teach about tools and generate clinically relevant results (Goodlett, Kubicki, Bouix).