Download
1 / 30
460 likes | 1.23k Views
CHAPTER 6 : KINETIC OF GROWTH IN BATCH AND CONTINUOUS CULTURES. Dr. Saleha ShamsudiN PPK BIOPROSES, UNIMAP 013-2081261.

E N D
CHAPTER 6 : KINETIC OF GROWTH IN BATCH AND CONTINUOUS CULTURES Dr. SalehaShamsudiN PPK BIOPROSES, UNIMAP 013-2081261
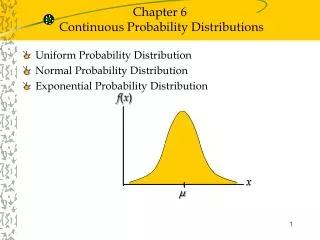
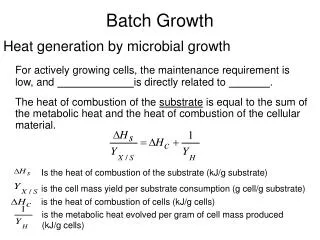
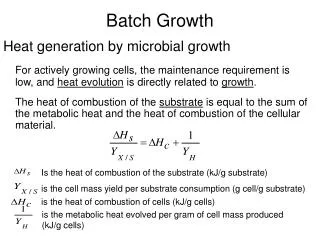
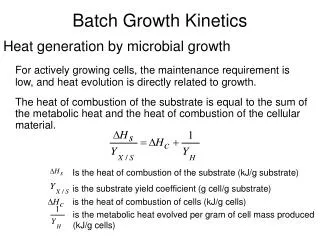
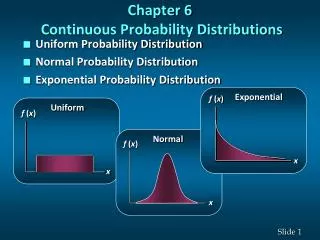
Kinetic of Growth in Batch CultureQuantifying cell concentrations, growth patterns and kinetics in batch culture, effects of environmental conditions on growth kinetics, heat generation by microbial growth.Kinetic of Growth in Continuous CultureSome specific devices for continuous culture, derivation for ideal chemostat, application of chemostat and its deviation of ideality.
Kinetic of Growth in Batch Culture • Biochemical reaction (living organism/specific condition-pH, Temperature) • Microorganism –not added in the desired quantities (unlike of chemical reaction). • Cell consume parts of nutrients-depend upon the types of cells (unicellular or moulds) • Complicated • Study that deal with speed-how fast is reaction is progressing. • Chemical kinetics-how the rate of reaction is dependent upon the concentration of the reactants. • A P • (-rA) = k (CA)n (1)
The process does not END here! Associated with cell growth, there are two other processes: Uptake of some material from the cell’s environment Convert it into some metabolic end products This starts destabilizing the cell growth AND the availability of substrate for competitive processes This indeed complicates the situation for directly applying Eq. (1)
The complexities in the kinetic study of biochemical reactions/processes can be summarized as follows: • The types of the cells (unicellular/moulds) affects the cell growth and physico-chemical characteristics of the fermentation broth • Nutrients and substrates are consumed concurrently and competitively for increasing the production of cell mass and bioconversion to metabolic products • Cell-to-cell heterogenity is the common problem in the growing cells • Cell of different ages often manifest several metabolic functions and activities • Characterization of biochemical pathway by a simple equation (1) is seldom possible.
Batch growth Growth conditions is constantly changing • GROWTH - is the most essential response of microbes to their physiochemical environment • Result – replication and change in cell size • Microorganisms can grow under a variety of physical, chemical and nutritional conditions • In a suitable nutrient medium, organisms extract nutrients from the medium and convert them into biological compounds. Parts of these nutrients are used for energy production and parts are use for biosynthesis and product formation. • As a result of nutrient utilization, microbial mass increases with time and can be described simply by: • Substrate + cell extracellular products + more cells • The rate of growth is directly related to cell concentration. • The rate of microbial growth (net specific growth rate) is defined as • unet = 1/X dX/dt or unet = ug - kd
Quantifying cell concentrations Batch growth – culturing cells in a vessel with an initial charge of medium that is not altered by further nutrient addition or removal. Quantifying cell concentrations is essential for the determination of the kinetics and stoichiometry of microbial growth. Methods used can be classified as: direct and indirect.
Determining cell number density • A Petroff-Hausser slide or hemocytometeris used for direct cell counting. • In this method, a calibrated grid is placed over the culture chamber. • The number of cells per grid square is counted using a microscope. • To be statistically reliable, at least 20 grid square must be counted and averaged. • The culture medium should be clear and free of particles that could hide cells or be confused with cells • Stains can be used to distinguish between dead and live cells. • This method is suitable for non-aggregated cultures. It is difficult to count molds under the microscope because of their mycelial nature
Colony-forming unit (CFU) • Plates containing appropriate growth medium gelled with agar (petri dished) are used for counting viable (capable of reproduction) cells. • Culture samples are diluted and spread on the agar surface and the plate are incubated. • Colonies are counted on the agar surface following the incubation period • The results are expressed in terms of colony-forming units (CFU) • If cells form aggregates, then a single colony may not be formed from a single colony • This method is more suitable for yeasts and bacteria • A large number of colonies must be counted to yield a statistically reliable number. • Growth media should be selected carefully since some media support growth better than others. • The viable count may vary, depending on the composition of the growth medium.
Determining cell mass concentration (Direct method) • Determining cellular dry weight • The most commonly used direct method for determining cell mass concentration • Applicable only for cells growth in solids-free medium, if solids such as molasses solids, cellulose or corn steep liquor are present, the dry weight measurement will be inaccurate. • Typically, samples of culture broth are centrifuged or filtered and washed with a buffer solution or water. The washed wet cell mass is then dried at 80°C for 24 hours; then dry cell weight is measured. • Packed cell volume • Is used to rapidly but roughly estimate the cell concentration in a fermentation broth. • Fermentation broth is centrifuged in a tapered graduated tube under standard conditions (rpm and time) and volume of cells is measured.
Another rapid method • Is based on the absorption of light by suspended cells in sample culture media • The intensity of the transmitted light is measured using a spectrometer. • Turbidity or optical density measurement of the culture medium provides a fast, inexpensive and simple method of estimating cell density in the absence of other solids or light-absorbing compounds. The extent of light transmission in a sample chamber is a function of cell density and the thickness of the chamber. • Light transmission is modulated by both absorption and scattering. • Pigmented cells give different results than unpigmented ones. • The medium should be essentially particle free • 600-700nm wavelengths are often used, blank against medium and the use of calibration curve • The calibration curve relates optical density (OD) to dry-weight measurements.
Indirect methods • Mold fermentations. • Based mainly on the measurement of substrate consumption and/or product formation during the course of growth • Intracellular components of cells such as RNA, DNA and protein can be measured as indirect measures of cell growth • During a batch growth cycle, the concentrations of these intracellular components change with time.
Growth patterns and kinetics in batch culture -Once liquid medium is inoculated with a seed culture (inoculum) -Organism selectively take up dissolved nutrient -Convert into biomass
Growth patterns and kinetics in batch culture Phases of cell growth • Several phases in batch culture • Lag phase (adaptation)– just after inoculation, they take some time to adjust to the new environment. Consequently, they start consuming the nutrients in the medium and multiply • depending on composition of nutrient, new enzymes are synthesized, some other enzymes are repressed & the internal machinery of cells is adapted to the new environmental conditions • these changes reflect the intracellular mechanisms for regulation of metabolic processes discussed in chapter 4 • cell mass increase a little without an increase in cell number density • Pseudolag phase- when the inoculum is small and has a low fraction of viable cells (poor condition of inoculum) • Besides that low concentration of some nutrient and growth factors and the age of the inoculum culture may also cause a long lag phase. (the lag period increases with the age of inoculum.) • Inoculum should be young and active. Inoculum size=5-10% by volume
Diauxic growth – multiple lag phases is observed when the medium contains more than 1 carbon sources. This caused by a shift in metabolic pathways in the middle of a growth cycle. • Log phase (logarithmic growth phase) – Cells have adjusted to their new environment • once the growth process starts, the cell multiply in an exponential order (rapid). The growth is very fast. This is also known as exponential growth phase. This phase is very important and all the kinetic growth parameters are studied in this phase. Since the growth is exponential in nature, when the cell concentration is plotted versus time on a semi-log plot, the log phase results in straight line. • This is a period of balanced growth – All component of cell grow at the same rate. The average composition of a single cell remain approximately constant during this phase.
Unet determined by cell number or cell mass would be the same. Since the nutrient concentrations are large in this phase, the growth rate is independent of nutrient concentration. The exponential growth rate is first order: X and X0 are cell concentrations at t and t=0. The time required to double the microbial mass is given by eq. 6.6. the exponential growth is characterized by a straight line on a semilogarithm plot of In X versus time:
Deceleration growth phase: growth decelerates due to either depletion of one or more essential nutrients or the accumulation of toxic by-products of growth. These changes occurred over a very short period of time. • The rapidly changing environment results in unbalanced growth • During unbalanced growth, cell composition and size will change td will not be equal. • In this phase, the stresses induced by nutrient depletion or waste accumulation cause a restructuring of the cell to increase the prospects of cellular survival in a hostile environment.
Stationary phase – Once the cell numbers reach a maximum (point C), they stop growing any more (net growth rate is zero). Hence, the growth become stagnant and the growth continues to point D. It is probably in this period, that they start converting the substrate into metabolic products. More and more amount of substrate goes for biochemical reaction to yield some useful products. • Even though the net growth rate is zero during stationary phase, cells are still metabolically active and produce secondary metabolites. • Primary metabolites are growth related products • Secondary metabolites are non-growth related. • These phenomena may take place during stationary phase: • Total cell mass concentration may stay constant, but the number of viable cells may decrease • Cell lysis may occur and viable cell mass may drop. • Cells may not be growing but may have active metabolism to produce secondary metabolites.
Stationary phase • The cells catabolizes cellular reserves for new building blocks & for energy-producing monomers – endogenous metabolism • The cell must always expend energy to maintain an energized membrane and transport of nutrients and for essential metabolic functions such as motility and repair of damage to cellular structures. • This energy maintenance is called maintenance energy.
Endogenous metabolism – the cell catabolizes cellular reserves for building blocks and for energy-producing monomers. Maintenance energy - The cell must always expend energy to maintain an energized membrane and transport of nutrients and for essential metabolic functions such as motality and repair of damage to cellular structures. The appropriate equation to describe the conversion of cell mass into maintenance energy or the loss of cell mass due to cell lysis during stationary is: Where kd is a first-order rate constant for endogeneous metabolism and Xso is the cell mass concentration at the beginning of the stationery phase. Because S is zero , ug is zero in the stationary phase.
The reason for termination of growth may be either exhaustion of an essential nutrient or accumulation of toxic products. If inhibitory product is produced and accumulates in the medium, the growth rate will slow down, depending on the inhibitor production, and at a certain level of inhibitor concentration, growth will stop. Examples: Ethanol production by yeast is an example of a fermentation in which the product is inhibitory to growth. Alleviate the adverse effects of toxin and yield further growth: Dilution of toxified medium Addition of an unmetabolizable chemical compound complexing with the toxin Simultaneous removal of the toxin
Death phase – the cells start decaying. After point D, probably cells face shortage of substrate for their consumption. Hence, they start decaying. The death phase (or decline phase) follows the stationary phase. Some cell death may start during the stationary phase. Often, dead cell lyse, and intercellular nutrients release into medium are used by the living organism during stationary phase. At the end of the stationary phase (because of nutrient depletion or toxic product accumulation, the death phase begins. The reestablisment of the culture may be possible in the early death phase if cells are transferred into a nutrient-rich medium. The rate of death usually follows first-order kinetics: Ns=concentration of cells at the end of the stationary phase Kd=the first order death-rate constant
Yield coefficients are defined based on the amount of consumption of another material. For example: the growth yield in a fermentation is At the end of batch growth period, we have an apparent growth yield because culture conditions can alter pattern of substrate utilization (the apparent growth yield is not a true constant). For example, with a compound (such as glucose) that is both a carbon and energy source, substrate may consumed as: Yield coefficients based on other substrates or product formation may be defined; for example,
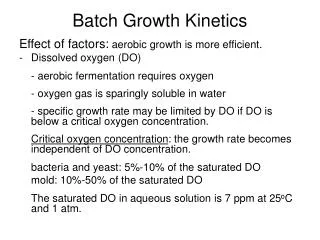
For organisms growing aerobically on glucose, Yx/s is typically (0.4-0.6 g/g for most yeast and bacteria; while Yx/o2 is 0.9 -1.4 g/g. Anaerobic growth is less efficient. Yield coefficient is reduced substantially (Figure 6.5). Table 6.1 lists some of examples of Yx/s and Yx/o2 for variety of substrates and organisms.
Cellular maintainance represents: energy expenditures to repair damaged cellular component to transfer some nutrients and products in and out of cells for motility and; to adjust the osmolarity of the cells interior volume Microbial growth, product formation and substrate utilization rates are usually expressed in the form of specific rates since bioreaction are autocatalytic (the reaction product itself is the catalyst for that reaction). The specific rates are used to compare the effectiveness of various fermentation scheme and biocatalysis.
Batch reactor data analysis • Batch reactor is frequently use to collect the kinetic data due to its ease of contruction and operation, versatility (the same bioreactor can be used for various reactions. The data are collected on concentration versus time and processed to evaluate the reaction rate constant given in Eq. (1) • The material balance of the reactants fed and the products formed gives us an expression for reaction time.
Microbial products can be classified in three major categories: Growth-associated products-produced simultaneously with microbial growth. The specific rate of product formation is proportional to the specific rate of growth, ug. Example: the production of a constitutive enzyme Non-growth-associated product formation – takes place during the stationary phase when the growth rate is zero.The specific rate of product formation is constant Example: Secondary metabolites (penicilin) Mixed-growth-associated products-takes place during the slow growth and stationary phase. Example: Lactic acid fermentation, xanthan gum