Download
1 / 40
400 likes | 563 Views
Energy Efficiency Policy Trends A Look Nationally. Katrina Pielli Clean Energy Program Manager Climate Protection Partnerships Division U.S. Environmental Protection Agency Florida PSC Energy Efficiency Initiatives Workshop November 29, 2007. Agenda. Today’s energy challenges and EE

E N D
Energy Efficiency Policy TrendsA Look Nationally Katrina Pielli Clean Energy Program Manager Climate Protection Partnerships Division U.S. Environmental Protection Agency Florida PSC Energy Efficiency Initiatives Workshop November 29, 2007
Agenda Today’s energy challenges and EE Issues Garnering Increased Interest “Quick start” EE programs Aligning utility incentives with EE Incorporating EE as a resource in utility planning processes Cost-effectiveness tests State examples Resources and Summary
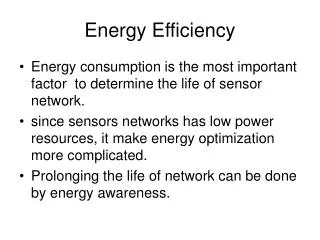
Energy Efficiency is a Key Part of the Solution to Today’s Energy Challenges • Environmental • Lower carbon emissions and criteria pollutants • Lower water use • Economic • Savings to customers • Lower cost (about half) compared to new G&T • Downward pressure on natural gas prices and volatility • Improved local economy, using local labor • Benefits low–income, seniors • Utility System Benefits • Near-term tool with persistent, long-term benefits • Improved security of systems • Lower baseload and peak demand • Reduce need for “hard to site” G&T assets • Targeted, modular, manageable • Risk Management • Diversifies utility resource portfolios • Zero carbon emissions Quick, cheap, and clean resource Energy efficiency is vast
Large Potential for Cost-Effective Energy Efficiency • McKinsey Global Institute’s Curbing Global Energy Demand Growth: The Energy Productivity Opportunity (May 07) - By capturing the potential available from existing technologies with an internal rate of return of 10% or more, we could cut global energy demand by half or more over the next 15 years. • ACEEE’s Energy Efficiency’s Role in a Carbon Cap-and-Trade System (May 06) - Doubling efficiency would cut load growth by about two-thirds in 2024, from about 20% to about 6% above 2006 levels. • Report of the Clean and Diversified Energy Advisory Committee to the Western Governors Association (WGA) (June 06) - By adopting the WGA's best practices scenario in the 18 WGA states, load growth could be reduced by as much as 75% over the next 15 years.
Despite Potential, Utility Sector Energy Efficiency Has Declined Annual Spending on Utility Sector Energy Efficiency Programs 1992-2003(2005 real dollars) Source: Data from ACEEE 2005 Scorecard adjusted for inflation using U.S. Department of Labor Bureau of Labor Statistics Inflation Calculator
Programs Help Overcome Key Barriers Limiting Efficiency • ENERGY STAR • Helps homeowners reduce energy use by 10, 20, or 30% while purchasing products, home improvements, or buying a new home • Helps businesses, public sector, schools reduce energy use by 10% or more • Overcomes lack of information, competing vendor claims, split incentives • Broad-based platform with government-backed credibility and network of retailers and manufacturers to leverage • Important utility barriers remain • Existing electricity and gas regulations / market rules provide additional financial incentives for supply-side resources • View that EE is not a reliable, measurable, cost effective resource • Concern that EE will raise rates • Lack of good documentation and guidance on demand-side programs Barriers important to address – do not go away with carbon regulation
Today’s energy challenges and EE Issues Garnering Increased Interest “Quick start” EE programs Aligning utility incentives with EE Incorporating EE as a resource in utility planning processes Cost-effectiveness tests State examples Resources and Summary
“Quick start” EE programs • “Quick Start“ programs are a basic set of programs that: • Are quick to get off the ground • Offer measurable benefits in the near-term • Can be expanded to a broader and more comprehensive set of programs over a few years • AR PSC completed a successful collaborative in 2006 which resulted in EE rulemaking in June 07. • Quick Start EE programs filed by 4 electric & 3 gas utilities; • Approved statewide EE education program and weatherization program for Severely Energy-Inefficient Houses; • Allows for cost recovery via rate rider.
“Quick start” EE programs (2) • Residential Sector • Promoting the purchase of ENERGY STAR qualifying lighting and appliances through existing supply channels with financial incentives for some products, coupled with education and outreach • Promoting retirement and recycling of old and inefficient appliances such as refrigerators, freezers, and room air conditioners through turn-in incentive programs. • Promoting proper functioning of existing residential HVAC equipment, as well as proper sizing and installation of new equipment. • Developing pilot-scale initiatives to promote comprehensive home energy improvements for existing homes through Home Performance with ENERGY STAR. • Developing pilot-scale initiatives to promote the construction of ENERGY STAR qualified new homes (both site built and manufactured) through builder networks.
“Quick start” EE programs (3) • Commercial Sector • Offering prescriptive incentives for lighting and HVAC measures to a broad range of commercial facilities along with education and/or technical assistance to promote increased efficiency in lighting and HVAC system design. • Offering prescriptive incentives to promote the purchase of ENERGY STAR qualifying commercial food service equipment for use in restaurants, hotels/hospitality venues, schools, and other applicable commercial or institutional facilities. • Developing pilot-scale initiatives to facilitate whole-building energy performance using the ENERGY STAR building performance rating system, coupled with incentives for energy efficient lighting and HVAC systems, and general education about building tune-ups and/or retrocommissioning to improve building operation and maintenance. • Promoting power management of computer monitors through direct outreach to large end users and online tools for smaller end users, along with education about additional opportunities for saving energy through purchase and proper use of ENERGY STAR qualifying office products.
Today’s energy challenges and EE Issues Garnering Increased Interest “Quick start” EE programs Aligning utility incentives with EE Incorporating EE as a resource in utility planning processes Cost-effectiveness tests State examples Resources and Summary
Aligning utility incentives with EE investment • Increased interest in broad topic by many stakeholders (Commissions, utilities, legislators, non-profits, etc) • Renewed interest in exploring decoupling • Idaho Power pilot in ID • Legislation in CT, NY, MN • Filing by Pepco in MD and DC • Docket in IA • LRAM seems to be out of favor • Large variety of approaches for performance incentives • CA – Rewards and penalties based on a) how well the utility met CPUC established energy savings targets; b) the economic benefits generated from the utility’s EE portfolio • NV – Enhanced ROR • Xcel Energy filings in NM and CO
The Status of EE Cost Recovery and Incentive Mechanisms for IOUs Source: Aligning Utility Incentives with Investment in Energy Efficiency- a Product of the National Action Plan for Energy Efficiency. 2007.
Idaho Power Pilot • Mechanism adopted to address impacts of EE program-induced changes in sales - should not be viewed as decoupling in the broadest sense of that term. • Mechanism focused specifically on recovery of lost fixed cost revenues. • PUC initiated proceeding in August 2004 to investigate financial disincentives to investment in EE by Idaho Power Company. Held a series of workshops and a written report was filed in early 2005. • Parties agreed there were disincentives preventing higher EE investment by Idaho Power, but no agreement was reached on whether or not the return of lost fixed cost revenues would result in removing the disincentives. • Parties agreed to conduct a simulation of the proposed mechanism, the results of which indicated that lost fixed cost revenues in fact produced barriers to EE investments and, therefore, a three-year pilot mechanism to allow recovery of fixed cost revenue losses should be approved.
Idaho Power Pilot (2) • Idaho Power filed in January of 2006 and requested authority to implement a Fixed Cost Adjustment (FCA) decoupling or true-up mechanism for its residential and small general service customers. • PUC approved the FCA as a three-year pilot program. • Program implementation began on January 1 2007 and will last through December 31, 2009 plus any carryover. • The first rate adjustment will occur June 1, 2008 and subsequent rate adjustments will occur on June 1 of each year during the term of the pilot. • FCA is applicable to residential and small general service customers, as the Company noted that these two classes present the most fixed cost exposure for the Company. • FCA is designed to provide symmetric rate adjustment (up or down) when fixed cost recovery per customer varies above or below a Commission established level. • FCA mechanism incorporates a 3% cap on annual increases with carryover of unrecovered deferred costs to subsequent years.
CA Risk/Reward Incentive Mechanism • CPUC decision issued September 20, 2007 • Reward • First opportunity if utility exceeds 85% of CPUC goals. • Reward of 9% of the total net benefits generated from its portfolio. • At 100% or above CPUC goals • Reward of 12% of the total net benefits generated from its portfolio. • Total rewards across all IOUs for each 3-yr program cycle capped at $450 million • Penalty • Savings below 65% of CPUC goals = penalty. • Larger of either: 1) summed per unit penalty for every kWh, kW and therm below goals; 2) any positive net costs to the EE portfolios • Total penalties across all IOUs for each 3-yr program cycle capped at $450 million. • Deadband • No reward or penalty if performance 65%-85% of CPUC goals.
CA Risk/Reward Incentive Mechanism (2) 85% of goal 65% of goal
HI DSM Docket • HI PUC Docket -- DSM Programs and Recovery of Program Costs and DSM Utility Incentives. 2 years to reach decision. • Decision on February 13, 2007 • Established EE goals for the “HECO Companies” until their next IRP dockets • Selected the appropriate market structures for providing DSM programs • Determined the cost recovery mechanisms for utility recovery of utility-incurred DSM program costs • Determined the types of costs that are appropriate for utility recovery of utility-incurred DSM program costs • Established the appropriate DSM incentive mechanism for the HECO Companies • Determined that HECO’s proposed EE DSM programs are likely to achieve the EE goals and be cost-effective • Established the appropriate cost level for HECO’s utility-incurred costs in base rates • Approved HECO’s proposed DSM utility incentive, with modifications • Approved HECO’s Proposed EE DSM Programs and Residential Customer Energy Awareness Program, with modifications
HI DSM Docket (2) • EE goals until next IRP: Based on MW and MWh savings that HECO Companies’ proposed EE programs could and would achieve. • C&I: 2007 - 91,549 MWh, 13,041 MW; 2008 – 137,324 MWh, 19,563 MW. • Residential: 2007 – 50,553, 13,336; 2008 – 66,914, 18, 068 • Non-Utility Market Structure for administering EE programs by Jan 2009. • Deferred decoupling for possible consideration in future. • Shared savings mechanism to serve as an incentive. • Cost-effectiveness of EE Portfolio: IRP framework requires use of 5 tests - utility cost, rate impact measure, participant impact, societal cost and total resource cost. • Most weight given to TRC. • Program Portfolio filed has benefit-to-cost rations above 1 for all tests but RIM.
Today’s energy challenges and EE Issues Garnering Increased Interest “Quick start” EE programs Aligning utility incentives with EE Incorporating EE as a resource in utility planning processes Cost-effectiveness tests State examples Resources and Summary
Incorporate EE as a resource in utility planning processes • Renewed interest in treating EE as a resource in planning • CA loading order • WA ballot initiative 937 – conservation is resource of first choice • NC IRP – comparison of demand and supply side options to determine the least-cost, long-term set of resources needed • ISO New England Forward Capacity Market – EE can bid in as a resource to provide capacity • TVA Board approved goal of 1200 MW demand reduction through EE and DR in 5 years.
Incorporate EE as a resource in utility planning processes (2) • WI legislation requires the PSC to conduct EE planning every four years; results incorporated into Strategic Energy Assessment by PSC. • AR PSC decision in June 2007 -- Resource Planning Guidelines, directs utilities to give “comparable consideration” to demand and supply resources and to assess “ all reasonably useful and economic supply and demand resources that may be available to a utility or its customers,” and to identify and investigate resources including “energy efficiency, conservation, demand-side management, interruptible load, and price responsive demand.”
Incorporate EE as a resource in utility planning processes (3) • Data necessary to integrate EE into resource planning are readily available • Cost and savings data • Potential studies for what is achievable through EE measures • Energy, capacity and non-energy benefits can justify robust EE programs • Clear path to funding is needed to establish a budget for EE resources • Integrate EE early in the resource planning process to capture the full value • Update resource plan as information changes
Today’s energy challenges and EE Issues Garnering Increased Interest “Quick start” EE programs Aligning utility incentives with EE Incorporating EE as a resource in utility planning processes Cost-effectiveness tests State examples Resources and Summary
Importance of cost-effectiveness tests • Several tests for evaluating EE cost-effectiveness, each reflect a different stakeholder perspective on the impact of EE. • Common misperception that there is a single best perspective for evaluation of cost-effectiveness. Each test is useful and accurate, but the results of each test are intended to answer a different set of questions. • Amount of cost-effective EE is different depending on perspective • Criteria for defining cost-effectiveness - the California Standard Practice Manual is authoritative source • Many other states now also refer to the California Standard Practice Manual as the source of their own cost-effectiveness criteria. • The California criteria include five major tests.
Snapshot of states use of cost tests No specific test/s required: • KY, PA, ME, IL, ND, OK, ID, WY, NC, SC All 5 tests required: • VA, IN, MN, CA, HI, GA • Doesn’t include info. from: MD, WV, MI, NE, OH, SD, AK, NV, TX, UT, WA, AL, LA, MS, TN
Source: Guide to Resource Planning with Energy Efficiency - a Product of the National Action Plan for Energy Efficiency. 2007.
Today’s energy challenges and EE Issues Garnering Increased Interest “Quick start” EE programs Aligning utility incentives with EE Incorporating EE as a resource in utility planning processes Cost-effectiveness tests State examples Resources and Summary
Energy Efficiency in Arizona • Policy Overview: • In September 1999, the Arizona Corporation Commission ordered utilities to include a system benefits charge (SBC) in their restructuring plans to fund demand side management programs, consumer education, etc. • The bulk of the SBC funding for IOUs finances the Environmental Portfolio Standard, which requires all utility companies that sell retail electricity in Arizona to generate a percentage of their electricity from renewable resources. There is no set percentage for EE programs. However, the public benefits fund for Salt River Project (the second largest utility in Arizona) does support several energy efficiency programs. • 2003-2004: 2.5-3% reduction in energy use for state buildings • 2004-2005: ~10% reduction in energy use for state buildings
Arizona Public Service Co. (APS) • In June 2003, APS filed an application for a rate increase and a settlement agreement was signed between APS and the involved parties in August 2004. The settlement agreement issued in April 2005, includes: • An annual $10 million base rate DSM allowance for the costs of approved “eligible DSM-related items,” defined as the planning, implementation, and evaluation of programs that reduce the use of electricity by means of energy efficiency products, services, or practices. Performance incentives are included as an allowable expense. • In addition to expending the annual $10 million base rate allowance, APS is obligated to spend, on average, at least another $6 million annually on approved eligible DSM-related items. These additional amounts are to be recovered through a DSM adjustment mechanism.
Arizona Public Service Co. (APS) • Programs implemented by APS: • ENERGY STAR New Homes • ENERGY STAR Lighting (CFLs) rebates • ENERGY STAR HVAC rebates • Home Performance with ENERGY STAR program is currently being developed • From 2005-2007, APS set the following goals for its DSM Portfolio: • 3,435,000 MWh in lifetime savings • 51.7 MW in peak demand savings, and • $68 million in net benefits
Energy Efficiency in Nevada • Policy Overview: • In 2001, the Nevada legislature enactedresource portfolio standard legislation. • In 2005 this law was amended to increase the portfolio requirement, but also to allow the utilities to use EE programs to help meet the requirements. • Under the new law, renewable energy and EE is required to meet 20% of the state's electricity needs by 2015. The contribution from EE measures to meet the portfolio standard is capped at one-quarter of the total standard in any particular year.
Energy Efficiency in Nevada • Nevada is the only state currently that allows recovery of EE program costs using capitalization as well as a bonus return on those costs. • Over the past several years, spending on EE programs has risen substantially, due to: • Rapid growth in electricity demand • Attempts by Nevada Power and Sierra Pacific Power to maximize the contribution of EE to resource portfolio requirements as those requirements grow.
Energy Efficiency in Nevada • Utility EE investments are mainly a product of IRP process. • The addition of the resource portfolio requirement and the ability to meet up to 25% of that requirement provides further incentive to pursue EE investment. • Most incurred costs associated with EE programs are recoverable pursuant to the Nevada Administrative Code 704.9523. • A utility may seek to recover any costs associated with approved programs for conservation and DSM, including labor, overhead, materials, incentives paid to customer, advertising, and program monitoring and evaluation.
Energy Efficiency in Nevada • Programs implemented (Nevada Power/Sierra Pacific Power): • ENERGY STAR Appliance rebates • ENERGY STAR Lighting (CFLs and fixtures) rebates • ENERGY STAR Plus Homes Program • Nevada Power and Sierra Pacific Power Energy Savings: • 2003: 35 GWh/yr, 16 MW • 2004: 78 GWh/yr, 21 MW • 2005: 93 GWh/yr, 33 MW
Today’s energy challenges and EE Issues Garnering Increased Interest “Quick start” EE programs Aligning utility incentives with EE Incorporating EE as a resource in utility planning processes Cost-effectiveness tests State examples Resources and Summary
Resources National Action Plan for Energy EfficiencyGuides and Papers www.epa.gov/eeactionplan • National Action Plan for Energy Efficiency Report • Aligning Utility Incentives with Energy Efficiency Investment • Resource Planning with Energy Efficiency • Conducting Potential Studies for Cost-Effective Energy Efficiency • Model Energy Efficiency Program Evaluation • National Action Plan Vision for 2025 EPA Clean Energy-Environment Guide to Action www.epa.gov/cleanenergy/stateandlocal • Sections on Energy Efficiency Portfolio Standards, Public Benefits Funds for Energy Efficiency, Portfolio Management Strategies and Utility Incentives for Demand-Side Resources.
Summary • Growing momentum across the country • Interest in learning how to increase use of EE • Recognition that EE is a valuable part of energy mix and is one key as the nation addresses climate change solutions
For More Information Katrina Pielli U.S. Environmental Protection Agency Clean Energy Program Manager (202) 343-9610 Pielli.Katrina@epa.gov www.epa.gov/cleanenergy