Download
1 / 12
130 likes | 285 Views
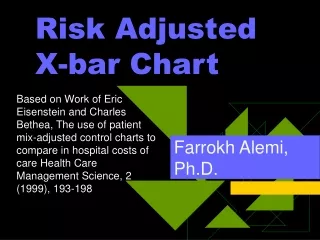
Multi-criteria Design of X-bar control chart. Zhaojun (Steven) Li IND E 516 Homework 1. Basics of an X-bar chart. A typical X-bar control chart:. Central line Upper /lower control limits (e.g., 3 sigma) How to evaluate the performance of a X-bar control chart? .

E N D
Multi-criteria Design of X-bar control chart Zhaojun (Steven) Li IND E 516 Homework 1
Basics of an X-bar chart • A typical X-bar control chart: • Central line • Upper /lower control limits (e.g., 3 sigma) • How to evaluate the performance of a • X-bar control chart?
Design of X-bar control chart • Performance metrics • Economic (cost) • Fast to detect a mean shift (effectiveness) • Fewer false alarms (efficiency) • All the above performance metrics could be integrated to one performance index in terms of cost
Main assumptions • The measurements of process characteristic follows normal distribution • Assignable cause occurs with a Poisson process • Mean shift from u0 to u0 + δ*σ • The process is not stopped even after an out-of-control point is detected Decision variables
Some performance metrics • Probability of false alarm (Type I error - α) • The detection power p after out-of-control
Some performance metrics-cont’d • The conditional expectation time of occurrence of the assignable cause within two consecutive samples • The expected number of false alarms • The average cycle length
Problem formulation • P(1) single objective formulation • a_1: fixed cost of sampling • a_2: variable cost of sampling • a_3: cost of searching • a_4: cost of investigating a false alarm • a_5: unit time penalty when operating in out-of-control status
Problem formulation-cont’d • P(2) Multi-criteria decision making • where • a_1: fixed cost of sampling • a_2: variable cost of sampling
Comparison of two formulations • Avoid the difficulties to estimate some costs associated with false alarms and operation in out-of-control status • Facilitate decision process (without specifying target values for some desired attributes • Provide more reasonable and wider solution choices
Discussion and future work • Propose and compare different methods in addressing the MCDM formulation of X-bar control chart • Develop and apply an algorithm to solve the multi-criteria X-bar control chart • Prune the possible large Pareto optimal solution set to few workable solutions/designs
Comments and Questions? Thank you