Download
1 / 12
120 likes | 243 Views
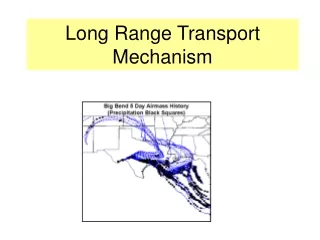
Using CO observations from space to track long-range transport of pollution. Daniel J. Jacob. with Patrick Kim, Peter Zoogman , Helen Wang. and funding from NASA. MOPITT CO validation during NASA/TRACE-P (Mar-Apr 2001). sample validation profile. DC-8 w/MOPITT AK MOPITT.

E N D
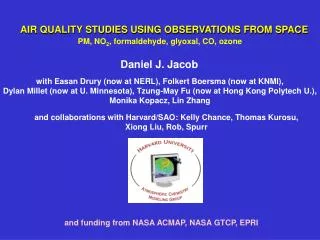
Using CO observations from space to track long-range transport of pollution Daniel J. Jacob with Patrick Kim, Peter Zoogman, Helen Wang and funding from NASA
MOPITT CO validation during NASA/TRACE-P (Mar-Apr 2001) sample validation profile DC-8 w/MOPITT AK MOPITT Validation statistics MOPITT MOPITT 12 km Pressure, hPa DC-8 data r2 = 0.98 bias = +6% CO, ppbv DC-8 0.3 km Asian outflow Jacob et al. [JGR 2003]
Annual mean CO column May 2004- April2005 Application of the GEOS-Chem model adjointto optimize CO sources using multi-sensor data AIRS EMEP NEI Streets MOPITT GFED EDGAR bottom-up annual sources Adjoint inversion TES SCIAMACHY (Bremen) correction factors emission Kopacz et al. [2010]
MOPITT NIR+TIR averaging kernel [Worden et al., 2010] MOPITT multispectral retrieval can separate optimization of CO sources and sink 200 Observations (2006) GEOS-Chem (GEOS-4) GEOS-Chem (GEOS-5) GEOS-Chem (-20% OH) 500 Below 800 hPa Free troposphere 800 330 160 hPa China CO, ppbv 150 60 150 110 South America 80 50 Patrick Kim (Harvard) J J D J J D
Interannual variability of Arctic spring pollution from AIRS COARCTAS demonstrated value of AIRS CO for tracking plumes over the Arctic 2003-2008 April mean AIRS CO Interannual anomaly (ENSO Index) 2003+ = 2004 = 2005 + = 2006 - = 2007 = 2008 - ARCTAS • European sector most polluted, N American sector cleanest • Transport of Asian pollution to the Arctic is correlated with ENSO through strength of Aleutian Low Fisher et al. [2010]
AIRS CO and OMI tropospheric ozone (700-400 hPa, 2008) NASA A-Train AIRS and OMI: Provide daily coverage Observe same scenes at same time of day Have similar averaging kernels AIRS OMI CO, MAM ozone, MAM ozone, SON CO, SON Patrick Kim (Harvard)
Slopes of RMA regression lines for O3 vs. CO at 700-400 hPa on 2ox2.5o grid (2008) ozone pollution outflow is correct OMI ozone and AIRS CO GEOS-Chem Ozone-CO correlations in the free troposphere stratospheric influence is too low Patrick Kim (Harvard)
GEO-CAPE: geostationary satellite observationof air quality over North America Ozone CO UV +Vis +TIR • Payload to include ozone and CO measurements with sensitivity in lowest 2 km • Achieving that sensitivity for ozone likely requires UV+Vis+TIR multispectral observation • Can model error correlation between ozone and CO enable such sensitivity through data assimilation? UV NIR +TIR Natraj et al. [2012]
How ozone data assimilation works – and how ozone-CO error correlation can help assimilate ozone observations produce ozone model forecast for to continuous 3-D field Improved ozone 3-D field at to produce forecast for to+t CO ozone ozone apply ozone-CO error correlations produce joint forecast for to+t CO CO CO forecast Improved CO assimilate CO observations
from GEOS-Chem simulations using GEOS-5 vs. GEOS-4 meteorological fields Ozone-CO model error correlations in surface air Afternoon error correlations, Aug 2006 ≡ GEOS-5 – GEOS4 O3 CO Negative error correlations over eastern US are driven by PBL height: PBL height Ozone CO Peter Zoogman, Harvard
Observation system simulation experiment (OSSE)shows benefit of accounting for ozone-CO error correlations in a data assimilation system for surface ozone RMSE for daily max 8-h average surface ozone in US in August 2006, and number of misdiagnosed exceedences of air quality standard (75 ppb) 813 7.0 675 5.9 476 487 Root-mean square error (RMSE) in ppb Number of exceedence errors (false positives or negatives) 4.7 4.2 forecast Ozone-CO error correlation enables a UV-only ozone instrument to perform comparably to UV+Vis+TIR instrument if error correlations can be adequately characterized Peter Zoogman, Harvard
GEOS-Chem CO2-CO column error correlations, GEOS-5 vs. GEOS-4 (2006) Using CO2-CO model error correlationsto improve CO2 surface flux inversions from satellite data Wang et al. [2009] January July • Correlations are positive in growing season, negative for growing season • OSSE suggests that joint CO2-CO inversion can reduce errors in CO2 surface flux inversions by up to 50% • Joint CO2-CO inversion can also reduce the aggregation error from temporal and spatial averaging of fire emissions Helen Wang, Harvard-Smithsonian