Download
1 / 20
200 likes | 328 Views
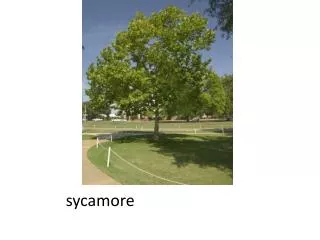
Sycamore Tree Health, Dispersal, and Soil Composition in Quarry Bottom Flood Zones. Zachary R. Young, Sarah Minor, Hunter Schouweiler. Introduction. Sycamore Trees ( Platanus occidentalis ) Frequently found in riparian and wetland areas. Moderately tolerant of flooding

E N D
Sycamore Tree Health, Dispersal, and Soil Composition in Quarry Bottom Flood Zones Zachary R. Young, Sarah Minor, Hunter Schouweiler
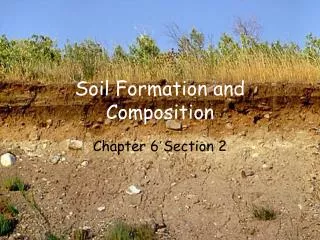
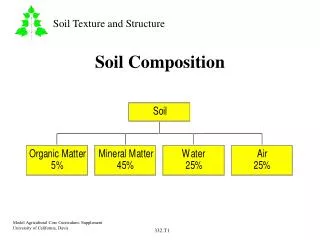
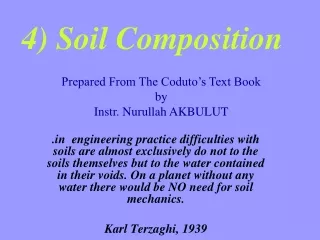
Introduction • Sycamore Trees (Platanusoccidentalis) • Frequently found in riparian and wetland areas. • Moderately tolerant of flooding • Growth standards and average age • Divided at the ground forming secondary trunks • Flaking is tree exfoliating, giving way to growth • Seed dispersal • Biotic and abiotic factors
Hypothesis • Flooding will have a negative effect on sycamore tree health. • Sycamore trees in the flood zone will have the lowest average health score due to greater frequency of anoxic conditions. • Sycamore trees on medium or large rock piles will have higher health scores than those on quarry bottom or flood zone mud because those trees on rock piles will have higher nutrient availability due to soil accumulation in rock pile
Methods • Designated 3 areas (area 1, 2, & 3) in which to sample sycamore trees • Collected data on all sycamore trees taller than 2m • Measurements: • Height of tree • Location of the tree: in, near, or far from flood zone • Type of soil: floodplain mud, quarry bottom; small, medium or large rock pile, and base of rock pile • Health score of tree • Each member of the group gave their health score independent of the other group members’ scores • Numbered each tree
Locations 1 2 3
Location Definitions • In the flood zone – at one point completely surrounded by water • We determined whether an area had been flooded at one point by looking for biofilm or recognizing other characteristics of flooding, such as depressed and dried out mud areas. • Near flood zone- within 3 to 4m of the floodplain or an elevated area, such as a rock pile, where some but not all sides of the elevated area are touching an area that at one point had been flooded • Far from flood zone – more than 3 to 4m from floodplain edge and no sign of flooding characteristics in immediate area
Health Index • Health Index Criteria: • 0 = cannot have any foliage, tree looks dried or withered, trunk may be deformed, no flaking bark • 1 = low/minimal foliage, trunk may be deformed, no flaking bark • 2 = about half of tree is covered in foliage, no misshapen trunk, little to no flaking bark • 3 = about three-quarters of tree is covered in foliage, good quality leaves and healthy trunk, flaking bark • 4 = near full foliage with good quality and healthy leaves and trunk, flaking bark
Description and Observation of Sampling Areas • Area 1 • Area 1 was enclosed by a Nature Park trail, a large hill, and the quarry pond. • The flood zone in this area was distinct – pronounced by a lip that formed the edge of the floodplain. Where there was not a lip, there was a distinct contrast in plant life that designated the edge of the flood zone. • There were no other flood zone habitats past this initial floodplain edge.
Description and Observation of Sampling Areas • Area 2 • This area was enclosed by the other side of the large hill, the continuation of the Nature Park trail, an area filled with cattails that extends from the far end of the quarry pond, and the quarry pond. • This area had a floodplain that was different from area 1. It had many channels and large transects that extended from the initial floodplain edge into the back of this area. These areas flooded less regularly.
Description and Observation of Sampling Areas • Area 3 • This area was unique from the other two areas • Ephemeral pond that is located in the southeast corner of the quarry bottom, right against the quarry wall • We defined the boundaries of this area as coming out from the pond and extending to a series of rock piles which made the back edge of the area and area of cattails that enclosed the remaining side of the sampling area that was not enclosed by the quarry wall. • The flood plain was again more dynamic than area 1, but less abstract than area 2. There were some areas were watered had once been pooled from flooding outside the initial flood plain.
Analysis of Variance for Health Score, Using Adjusted SS for Tests
Analysis of Variance for Health Score, Using Adjusted SS for Tests
DiscusionSummary of Results • “Near” trees performed the best in relation to health score. • “In” trees performed the worst as shown by flood zone mud health scores. • Sycamores on rock piles, regardless of location, had the highest health scores • The effect of flood treatment on health score was almost significant over all areas. This was probably due to the data from area 2, which had zones that were less clearly defined due to minor discrepancies of relative watershed height. • Height was significantly related to health score.
DiscussionVariation between In, Near, Far • Trees that were labeled “In” had the lowest health scores: • Anoxic soil conditions • Decreased photosynthesis due to stomata closure and decreased macronutrients (N,P,K) • Flooding causes growth reduction in roots more than shoots. This leads to trees being less drought tolerant. • Increased sedimentation leads to a change in the root and soil water potentials and poor macroinvertebrate post-flood decomposition • Trees labeled “Near” had the highest health scores: • Moderately flood tolerant • Same negative effects for “In” and “Far” sycamores most likely generate positive effects for “Near” trees • Sycamores thrive in riparian zone habitats • Sycamore trees that were on rock piles in the “In” location are on the same plain as near or far trees, avoiding the poor flooding conditions
Works Cited • Jones, Robert H., Rebecca R. Sharitz, and Kenneth W. McLeod. "Effects of Flooding and Root Competition on Growth of Shaded Bottomland Hardwood Seedlings." American Midland Nationalist 121.1 (1989): 165-175. Print. • Gregory, Stanley V., Frederick J. Swanson, W. Arthur McKee, and Kenneth W. Cummins. "An Ecosystem Perspective on Riparian Zones." BioScience 41.8 (1991): 540-551. Print. • Kozlowski, T. T. "Plant Responses to Flooding of Soil." BioScience 34.3: 162-67. Web. <http://www.jstor.org/stable/1309751