Download
1 / 12
120 likes | 216 Views
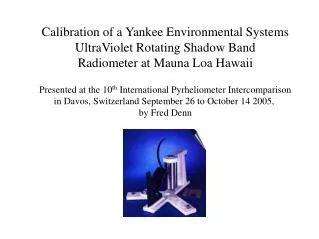
Calibration of a Yankee Environmental Systems UltraViolet Rotating Shadow Band Radiometer at Mauna Loa Hawaii Presented at the 10 th International Pyrheliometer Intercomparison in Davos, Switzerland September 26 to October 14 2005, by Fred Denn. Why is UV important? Health effects

E N D
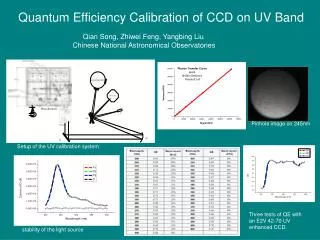
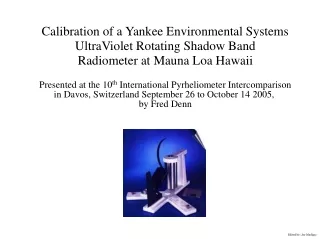
Calibration of a Yankee Environmental Systems UltraViolet Rotating Shadow Band Radiometer at Mauna Loa Hawaii Presented at the 10th International Pyrheliometer Intercomparison in Davos, Switzerland September 26 to October 14 2005, by Fred Denn
Why is UV important? Health effects Agriculture Energy deposition in the atmosphere How to measure? Satellites Ground stations
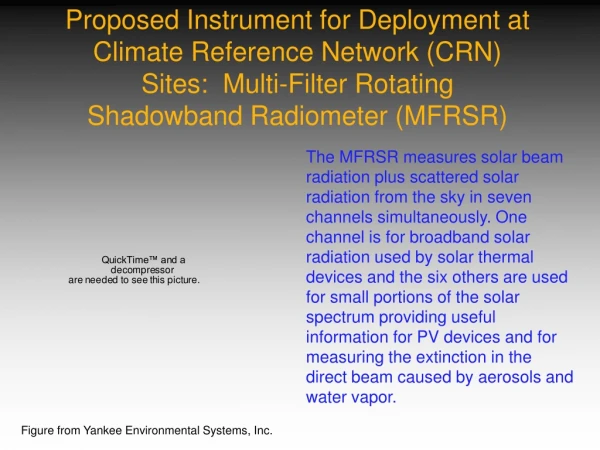
Satellite derived top of atmosphere spectral measurements are used to determine global and temporal UV surface irradiance and atmospheric energy deposition. Surface measurements are made, to verify the results of the atmospheric radiative transport models, requiring well calibrated surface instrumentation. A method of calibrating UV-MFRSRs using satellite derived UV spectrum is presented.
The UV-MFRSR is located at the Mauna Loa Observatory, Hawaii for a period of time each year because of the exceptionally clear and stable atmosphere. Langley analysis are performed, on the morning data, to determine top of atmosphere values. Mauna Loa observatory Hawaii
Langley plots were used to select morning data periods used in later analysis. To be considered a good the standard deviation of the residuals must me less than 0.006
The daily values were plotted for the entire time period, means and standard deviations were determined. These means will be compared to values derived using the MFRSR spectral response and the SOlar Radiation and Climate Experiment (SORCE) satellite measured extraterrestrial UV spectrum.
Overview of Method Use a spectral line lamp to verify functionality of a monochromator. Determine the normalized functional response of the UV-MFRSR head. Preform a numerical integration using the UV-MFRSR spectral response function and a satellite derived UV spectrum.
Top of Atmosphere MFRSR Measured Values and the Values Determined From the MFRSR Spectral Response Function and the SORCE Spectrum are Compared.
TOA values are determined, and scale factors used to adjust the MFRSR derived values to more true values. Normalized to 1 au Wavelen, nm Scale factor ±U95% TOA, W/m2 ±U95% 300.2 1.11 23.7 0.405 16.8 305.6 0.94 9.62 0.547 6.8 311.7 1.04 7.92 0.641 5.6 317.8 1.11 8.63 0.677 6.1 325.4 1.09 7.21 0.824 5.1 332.5 1.26 8.49 0.947 6.0 368.1 1.05 7.21 1.169 5.1
Verification of New Values Corrected Wave len SIM derived TOA UVMFR-7 TOA Difference nm W/m2 W/m2 W/m2 ------- ------- ------- ------- 300.2 0.408 0.405 0.003 305.6 0.547 0.547 0.000 311.8 0.642 0.641 0.001 317.8 0.678 0.677 0.001 325.4 0.825 0.824 0.001 332.5 0.948 0.947 0.001 368.1 1.171 1.169 0.002
Conclusion Manufactures calibration can be improved by applying Langley analysis to the output values supplied by there software.
Acknowledgments NASA Langley PMOD U.S. Coast Guard