Low birth weight
140 likes | 538 Views
Low birth weight. Zahra N. Sohani Supervisor: Dr. Sonia Anand. Background & brief methods of project Issues to consider for analysis. Outline of presentation. Low birth weight & type 2 diabetes – Epidemiological evidence.

Low birth weight
E N D
Presentation Transcript
Low birth weight Zahra N. Sohani Supervisor: Dr. Sonia Anand
Background & brief methods of project Issues to consider for analysis Outline of presentation
Low birth weight & type 2 diabetes – Epidemiological evidence Hales & Barker reported an increase in incidence of IGT and T2DM in children born small Systematic review of 31 studies (n=6090 diabetes cases) showed a 25% reduction in odds of T2DM per kg of weight gained Another study comparing birth weight <2.5 kg with ≥2.5 kg found a 32% increase in odds of T2DMfor those born with low birth weight
The hypotheses Impaired beta cell function Insulin resistance in utero perturbations cause the fetus to develop peripheral insulin resistance, to divert nutrients to essential organs results in permanent reductions in skeletal muscle glucose transporter number and/or function, causing extensive insulin secretion from the pancreas early in childhood, but eventual beta cell exhaustion Children with IUGR show greater insulin response than those born with normal birth weight • fetal period is critical for pancreatic development • impairment in beta cell development leads to reduced insulin secretion, which results in reduced fetalgrowth • Beta cell genes are also associated with birth weight • Studies of human fetuses with growth restrictions have reported reduced pancreatic endocrine cell mass
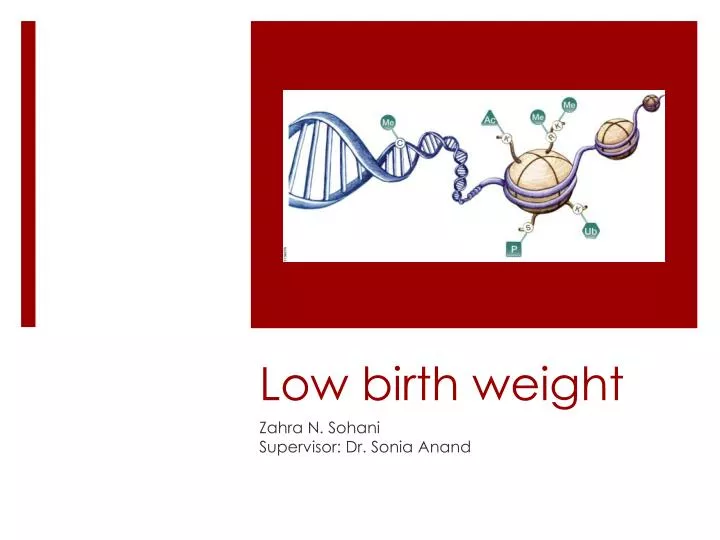
Is there support for epigenetics? • Methylation is one of the commonly studied epigenetic marks • addition of a methyl group to the 5-carbon position of a cytosine residue located next to guanine • methylation can lead to the binding of methylated CpG binding proteins and transcriptional repressors to the methyl group which block transcription factor access • presence of the methyl group itself can inhibit binding of necessary transcription factors to initiate the process via steric hindrance • DNA methylation is erased throughout the genome and then re-established during embryogenesis & gametogenesis
Allows for ‘soft inheritance’ • Human studies • Inheritance of MLH1 epimutation (linked to certain cancers) • Germlineepimutation of MSH2 in a family with hereditary nonpolyposis colorectal cancer • Animal models • model of rats demonstrated persistence of LBW for three generations after re-introduction of normal nourishment to offsprings of malnourished mothers
Questions • Are there differentially methylated regions associated with birth weight? • Is there a difference in these regions between South Asians and white Europeans?
Cardio-metabolic profile in South Asians South Asians have greater visceral adiposity, and experience metabolic abnormalities at lower a BMI and younger age than Europeans South Asian babies show a thin-fat phenotype South Asian newborns are born lighter even after generations in ‘western’ countries
Brief methods • Phenotypes: birth weight, birth length, and percent body fat • Genotypes: SNPs involved in beta cell function, insulin resistance, birth weight, adiposity, birth length, percent body fat, type 2 diabetes, and obesity in newborns and adults • Methylation/Expression:Differentially methylated regions for SNPs involved in beta cell function, insulin resistance, birth weight, adiposity, birth length, percent body fat, type 2 diabetes, and obesity • Look for gene expression differences if any DMRs are significantly associated with phenotype
Some current evidence • Three significant methylation studies investigating birth weight • Engel (2014) report Bonferroni-corrected associations for 19 CpGs with birth weight • Tarun (2012) identified 23 genes for which methylation collectively explained 70-87% of the variance in birth weight • Gordon (2012) found methylation in 8 genes to be associated with birth weight after correction for multiple testing
Issues to consider Beta values versus M-values Du BMC Bioinformatics 2010
Titration experiment of two samples known to be differentially methylated: 100:0, 90:10, 75:25, 50:50, 0:100 Methylation profile as established by beta values and M-values should correlate to titration profile
Beta-value method has a direct biological interpretation - it corresponds roughly to the percentage of a site that is methylated M-value method is more statistically valid, but does not have an intuitive biological meaning