
Computerized PAC Waveform Interpretation
E N D
Presentation Transcript
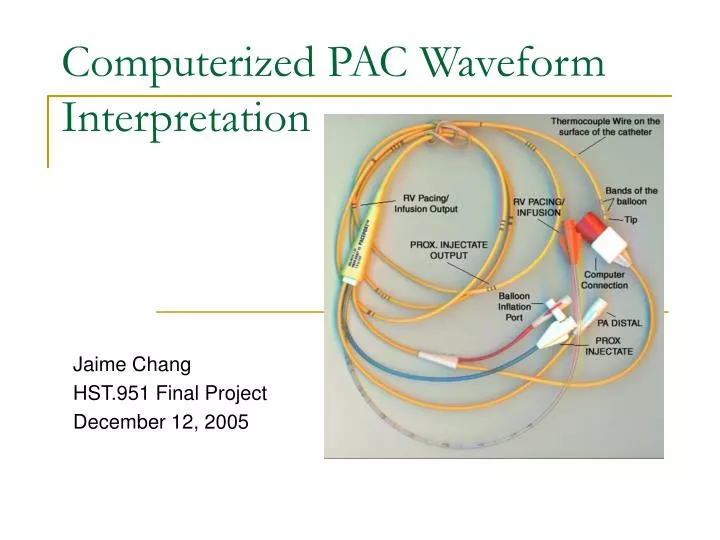
Computerized PAC Waveform Interpretation Jaime Chang HST.951 Final Project December 12, 2005
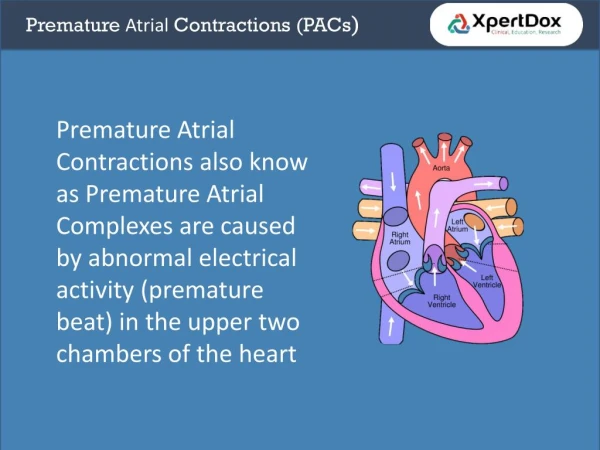
The Pulmonary Artery Catheter (PAC) • The pulmonary artery catheter (PAC) has been used for decades in the diagnosis and treatment of critical care patients. • The PAC is an invasive device used to measure the following: • cardiovascular pressures • cardiac output • mixed venous oxygen saturation
Significance of the PAC • Use of the PAC is considered routine in most critical care areas. • Estimated sales in the U.S. is 1 to 2 million per year. • Data derived from the PAC alters the course of therapy in about half of all insertions. • Pulmonary artery occlusion pressure (PAOP), for instance, is used to decide whether to give or remove fluid volume from the patient.
The Problem • Despite its long history of use, the PAC has never been shown to be beneficial in terms of outcomes. • One possible explanation for this is the lack of knowledge among physicians and nurses in its use. • Iberti et al. (1990): 47% of 496 North American physicians did not correctly identify PAOP from a PAC trace. • Gnaegi et al. (1997): 50% of 535 European physicians did not correctly identify PAOP from a PAC trace. • Burns et al. (1996): 39% of 168 critical care nurses in California did not correctly identify PAOP from a PAC trace.
Computerized Waveform Interpretation • Whereas computerized electrocardiogram (EKG) waveform interpretation has been available for decades, there is no equivalent software for PAC waveforms. • Unlike in the case of the EKG, where almost all the necessary information is in the waveform itself, the interpretation of PAC waveforms is highly context-dependent.
PAC Waveform Context • To properly interpret a PAC waveform, the following context information is required: • Source of the waveform (distal vs. proximal port) • Balloon status (deflated vs. inflated) • Accompanying EKG • Respiratory status (spontaneous respiration, positive pressure ventilation, or both) • Ventilator settings (if applicable)
PAC Waveform Elements • Pre-processing analog PAC waveforms is a challenge, but suppose that such software already exists and can return to us the following basic PAC waveform elements: • Highest peak (HP) pressure • Lowest trough (LT) pressure • Difference between HP and LT • Midpoint between HP and LT • EKG rhythm (regular vs. irregular) • EKG location of peaks • Range of peaks • Range of troughs
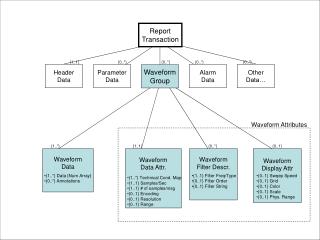
Classes of Interest • Dangerous vs. safe • Catheter tip (distal port) irritation of the right ventricle can cause a deadly arrhythmia. • Overwedge of an inflated balloon in a pulmonary artery may cause pulmonary infarction. • Problem vs. no problem • All dangerous situations are problems. • System errors (such as underdamping, overdamping, inappropriate transducer level) are not immediately dangerous, but can contribute to improper treatment decisions. • Source location (CVP, RV, PA, PAOP, Overwedge) • System artifacts vs. abnormal physiology vs. normal
Data Set • The data set includes 66 waveforms, each described by context, pre-processed waveform elements, and classification by experts. • Danger: 5 dangerous, 61 safe • Problem: 14 problems, 52 non-problems • Location: 18 CVP, 3 RV, 21 PA, 22 PAOP, 2 Overwedge • Predominant Feature: • 15 normal • 9 arrhythmias • 13 large waves • 14 respiratory variation • 11 frequency response artifacts • 1 improperly leveled transducer • 1 unspecified system artifact • 2 overwedge
Attribute Selection in Weka • For each type of classification, use Ranker on the full data set to determine information value of each attribute. • Discard attributes of zero information value. • Danger: discard peak variation, trough variation • Problem: discard lowest trough, trough variation • Location: discard peak variation, trough variation • Feature: discard lowest trough, HP-LT difference
Top Ranked Attributes • Danger • Highest peak (0.15) • Lowest trough (0.12) • HP-LT midpoint (0.12) • Problem • HP-LT difference (0.42) • Highest Peak (0.42) • HP-LT midpoint (0.35) • Location • HP-LT midpoint (0.90) • Balloon status (0.87) • Highest peak (0.85) • Feature • Trough variation (0.69) • Peak variation (0.65) • Peak location (0.65)
Classification Strategy • Use 3-fold cross-validation for such a small sample size, so that the training and test sets are both of acceptable size. • Compare classification with 1-nearest neighbor, decision tree, naïve Bayes, and neural network (multilayer perceptron).
Danger • 5 of 66 waveforms (7.6%) are dangerous.
Location • 22 of 66 waveforms (33.3%) are PAOP.