
Uploaded by
quin-serrano
1 SLIDES
155 VIEWS
10LIKES
0.5
DESCRIPTION
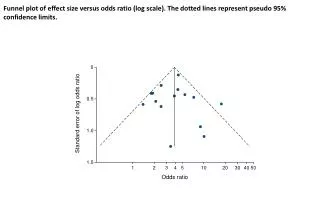
Funnel plot of effect size versus odds ratio (log scale). The dotted lines represent pseudo 95% confidence limits. 0. 0.5. Standard error of log odds ratio. 1.0. 1.5. 1. 2. 3. 4. 5. 10. 20. 30. 40. 5 0. Odds ratio.
Download
1 / 1
Download Presentation 
0.5
An Image/Link below is provided (as is) to download presentation
Download Policy: Content on the Website is provided to you AS IS for your information and personal use and may not be sold / licensed / shared on other websites without getting consent from its author.
Content is provided to you AS IS for your information and personal use only.
Download presentation by click this link.
While downloading, if for some reason you are not able to download a presentation, the publisher may have deleted the file from their server.
During download, if you can't get a presentation, the file might be deleted by the publisher.
E N D
Presentation Transcript
Funnel plot of effect size versus odds ratio (log scale). The dotted lines represent pseudo 95% confidence limits. 0 0.5 Standard error of logodds ratio 1.0 1.5 1 2 3 4 5 10 20 30 40 50 Odds ratio


More Related