Download
1 / 136
0 likes | 3 Views
Rachel Charson Memorial Slides

E N D
Food Security or Food Democracy?: awkward questions in food policy Tim Lang Centre for Food Policy City University, London, UK t.lang@city.ac.uk Rachel Carson Memorial Lecture, PAN-UK @ Brunei Gallery, SOAS, London December 6, 2007 1
This lecture (summary) • Timely to review the ‘big picture’ on progress towards an environment-led food policy • Issues of not just evidence but principle raised • Current food policy is wrapped up in mythic consumer sovereignty • Reality is more complex (retail power + weak state) • Meanwhile, major eco + social + econ determinants are emerging • Doing nothing about Sus Dev’t not an option 2
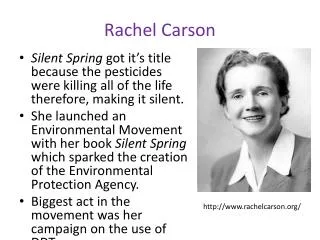
Homage to Rachel Carson (1907-1962) • Scientist: searching evidence • Poet: interpretative voice • Campaigner: speaking out • Philosophy: costs of progress • Ecological health: nature as agri/cultural ‘canary’ for human health 3
Food policy is a matter of principle Four principles must help reshape food policy: 1. People + planet = ecological public health 2. Food culture needs a new direction 3. Downgrade choice; choice within limits = less for the rich, more for poor? 4. Food democracy pursued as a social / policy goal 4
1. Eco public health (people + planet) • Old view: health is a function of inputs and outputs. It’s about physiology / bodies • New view: Eco PH is a function of relationships • Implications for food policy: – Draw across disciplines – Food policy must tick lots of boxes not just bodies – Group in 4 domains: material, physiological, social, cultural • Current rating: not happening 5
2. Re-shaping food culture. SusDev is not a niche bolted on to business-as-usual • Old view: progress follows material gain • New view: above $x, gain tails off • Implications for food policy: – ample evidence of over-consumption ? problems – Market focus on consumerism isn’t delivering Sust Dev – No clear vision on what sustainable food systems would look like – Consumers, supply chain & state all need to unlock ‘lock-in’ • Current rating: no clear guidance from policy 6
3. Choice within limits • Old view: consumers are arbiters of markets; governments’ role is slight • New view: choice creates problems. Choice- editing happens already (by retailers + markets) • Implications for food policy: – How to democratise choice-editing? – Governments in awe of retailers: ‘leave it to Tesco’ • Current rating: the elephant in the room 7
Policy treats food as though here Retailers here Poor here Rethinking choice Restrained / simple choice Unbridled choice Informed choice Choice-editing Total institutions Rationing Social & Eco Policy Issues: - What / who frames the choice & how? - Impact of choice: short / long term? ? - Who gets the choice, who doesn’t & why? - Rebalancing Government, supply chain & consumers? ? Lifecycle assessment 8
Shifting power in the food value-added chain PERIOD FARMING MANU- FACTURE Minor WHOLE- SALE Major in a few trades Major in many trades Dominant RETAIL FOOD- SERVICE Dominant ≤ 1900 Dominant Very Minor 1900 1950 1960 1970 1980 2000s 2000s-?? Declining (but WW2) Rebuilding (CAP!) Declining Dominant Minor Declining (but WW2) Latent Dominant Emerging Declining Rapidly Declining Minor Dominant Emerging Returning Uncertain Dominant Emerging adapted from: C. von Schirach-Szmigiel (2005) “Who is in Power Today and Tomorrow in the Food System”, keynote speech to the Policy and Competitiveness in a Changing Global Food Industry conference, USDA Economic Research Service, Washington DC, April 28 9
Power is real: in EU supply chain (15 MS): Retailers not Farmers dominate 10 Source: J-P Grievink, Cap Gemini, OECD 2003
4. Long struggle for food democracy must not be trampled to protect planet • Old view: adequacy of supply is key (productionism = quantity-focused). Food rights. Food control is needed in crises (WW2) • New view: SusDevFdPol = how + what + who • Implications for food policy: – we are sleep-walking into crisis (judging food by price) – Sus Dev Fd Policy could go either way democracy or control • Current rating: food democracy subsumed into consumer choice ideology 11
Food democracy: some UK moments • Adulteration campaign 1820-1870 (1895) • School meals (1904) • Royal Commission of Food Supply 1905 • Co-op Womens Guild + Hunger Marches 1930s • WW2 rationing + DfV ?1947 Agriculture Act • Food campaigns 1980s ? 1990 Food Safety Act + Food Standards Act 2000 • Peasants’ Revolt 1381 (John Ball, Wat Tyler, Jack Straw) • Speenhamland 1795 (poor relief for food prices) ? • Captain Swing riots 1830 (Luddism) • Campaign about Corn Laws ? Peterloo 1819 • Repeal of Corn Laws 1846 (repeal Importat’n Act 1815) 12
Food democracy is about… • Movements: from Anti adulteration (C19th) to Co-op Womens’ Guild (early C20th)? PAN, LFC/FC & Sustain (late C20th) • ‘Bottom up’ more than ‘top down’ • Civil society demands on supply chains & state • Proposing: social justice, equity, decency, affordability • Resisting: food control (unfair) 13
Is the forward march of food democracy gaining, faltering or halting? 14
In late C20th, Western food democracy became appropriated by • Consumerism • Consumer votes theory • Drowned in products: abundance in West • Triumph of Western model of consumption (Nutrition Transition) • Success of C 20thproductionism 15
Food Policy: the dominant view • The productionist paradigm (1940s ff) has been broadly successful • Its success was due to timing + evidence + WW2 + fearful legacy of 1930s • It delivered more food for more people • Trouble ahead requires another sci-tech revolution (if not GM something else) • Policy advance is held back by irrational consumers in Europe 16
The counter view • Productionism succeeded but is now in serious difficulty (health, envir’t, culture, energy) Food supply chains are ‘locked-in’ unsustainably Policy is not helping tackle this due to fragmentation & ‘crabby incrementalism’ Policy-evidence mismatch is cemented by institutional structures, corporate power and neo- liberal ‘choice’ culture. Not ‘fit for purpose’ Recognition is not helped by fragmented policy boxes (health, environment, social justice, labour) • • • • 17
The Era of Food Wars Agricultural Revolution Life Sciences Intensification paradigm Industrialis- ation of Food Productionist paradigm Food Wars Chemical Revolution Ecologically Integrated paradigm Transport Revolution 1800s 1900s 1950 2000 2050 LEGEND: = Key Battlegrounds in the Food Wars. These include: •Diet, health and disease prevention •Environm ental crisis •Capturing the consum er •What sort of food business •Com peting visions and ideologies •Controlling food supply 18
The architects of post WW2 Food & Agric policy • Sober optimists @ Hot Springs 1944: Boyd Orr etc • Vision: Science + Capital + Govt leadership would: – Get farmers back farming but doing it better – Improve health by making food plentiful – Feed the starving (Asia) and poor (everywhere) – End waste through efficiency – Invest in technology to increase productivity = a welfarist, benign and positive vision • It legitimated a range of big leaps forward: from the Green revolution to the World Food Programme + much more 19
World population and agricultural production 1961-2005 source: FAO / Defra FdSec Dec 2006 fig 5.1 20
Success stalled? Undernourished projected by WFS & observed source: FAO State of Food Insecurity in the World 2004 p5 21
24 Source: FAO SOFA 2006 p4
What’s the problem? • The standard progressive line: – Enough food is being produced – It’s being mal-distributed • Policy advice that follows: – Redistribute? No-one actually says that! It means threatening rich consumers (the West) – Instead (if at all): raise the consumption of the poor • The problem with this: – How the rich/‘fed’ are eating is unsustainable – V strong evidence of –ve impact of ‘what’ and ‘how’ we eat • Result: just when sustainable food looks essential, another food revolution is being proffered as inevitable 25
Post WW2 FoodPol bargain under systemic threat: • Rising food prices • Social inequalities • Demography / urbanisation • Land • Oil / energy • Climate change • Water • Health • Meat culture 26
Different urgency for policy-makers • By region: – eg. H2O crisis now for Australia / Middle East; UK later • By leverage: – eg. food insecurity big now in Africa; UK later? – eg. obesity = cost issue for rich cos, not yet for LDCs • By social manifestation: – E.g urbanisation = huge for China, India; past for UK? • Challenge for civil society is to even out these issues’ traction with policy-makers (PMSU) 27
Supply Chain under pressure Ecology & Environment Demographics Government & politics Culture Health Societal demands Supply Chain Dynamics: farm, manufacture, retail, Finance & investment Science & Technology foodservice Energy Climate Change Consumers 28
Complexity of what has to be woven together by policy-makers • ‘Old’ issues…. – Soil, water, health, land • Reshaped by ‘new’ issues: – Globalisation, climate change, peak oil ….all this…. • in an era of changed governance (more later!) 29
Food prices (home territory) 30
World Bank on food security “…the future is increasingly uncertain. Models predict that food prices in global markets may reverse their longterm downward trend, creating rising uncertainties about global food security.” World Bank (2007) World Development Report 2008: Agriculture for Development . New York: World Bank pg 8 31
source: IMF Survey Magazine 17 October 2007 source: IMF/ FT Oct 23 2007 32
Upward global pressures after decades of drop (for the rich) Source: Defra (2006). Food Security. Dec 22 p.15 Source: FAO Food Outlook June 2007 pg 1 33
Upward pressures • Downside: – Grain: wheat +100%; maize + 50%; rice + 20% – Energy prices: peak oil? food vs fuel. 20% US maize ? ethanol in 2006 – Population: India + China more affluent buyers – Import bills: + US$400 bn (2007), rise c5% on 2006FAO/GIEWS Food Outlook No. 1, Jun 2007 • Upside: – Plantings up: new gains for (big) farmers – new focus on land as prime resource: e.g. E Europe re-enters grain trade 34
Urbanisation 36
GLOBAL URBANISATION 80 70 60 Percentage of Population (Rural) Percentage of Population (Urban) 50 40 30 20 10 0 1950 2010 1960 1970 1980 1990 2000 2020 2030 Source: Population Division of the Department of Economic and Social Affairs of the United Nations Secretariat, World Population Prospects: The 2002 Revision and World Urbanization Prospects: The 2003 Revision, http://esa.un.org/unup, 17 May 2004 37
38 Source: UN Habitat (2006). Urbanization Facts & Figures. Nairobi
Source: UN Habitat (2006). Urbanization Facts & Figures. Nairobi Source: UN Habitat (2006). Urbanisation Facts & Figures. Nairobi 39
World's Largest Countries 2,000,000,000 1,600,000,000 Population 1,200,000,000 800,000,000 400,000,000 0 China China Japan India India Brazil Brazil Nigeria Nigeria Indonesia Indonesia Bangladesh Mexico Pakistan Bangladesh Pakistan Russia United States United States Congo (Kinshasa) 2003 2050 US Bureau of the Census, International Data Base http://www.census.gov/cgi-bin/ipc/idbrank.pl 40 [18 May 2004]
Labour 41
Global labour • 50% of world’s workforce works in agriculture source: ILO 2005 World Day for Safety and Health at Work 2005: A Background Paper p7 • Of that 1.1bn workers: – 450m (40%) are waged labour – 170m children – 20-30% is women (lower wages; export trade) P Hurst (2005) Agricultural Workers and their Contribution to Sustainable Agriculture and Rural Development. FAO/IUF/ILO • Hrs of labour to buy 1kg cereals: – Sweden 5 mins; India 37 mins; Cent Afr Rep 6hrs ILO (1996) Farm wage labour: poorest of the rural poor • Half the c355k at work fatalities p.a. are in agriculture P Hurst (2005) Agricultural Workers and their Contribution to Sustainable Agriculture and Rural Development. FAO/IUF/ILO • ILO estimates pesticides cause: – “c.70k acute and long-term poisoning cases leading to death and a much larger number of acute and long-term non-fatal illnesses.” Source: ILO 2005 World Day for Safety and Health at Work 2005: A Background Paper p7 42
Changes in the number of holdings in EU-6, 1967-1997 Source: Thirty years of agriculture in Europe, Arable land, increased size of holdings changes in crop rotation, Statistics in Focus, EUROSTAT • 43
UK food employment (2006) source: Defra FoodStatsPocketbk 2007 • 3.22 m employees in the food sector • split part-time / full-time (1.6m each) • food sector accounts for 19.2% national p-t & 8.8% national f-t • 96% of p-t food employees are in retailing & non-residential catering 44
E+W AGRIC LABOUR FORCE 1996-2007 NB 1983-1996 decline of total agri labourforce was 28% (1996= change of data collection methodology) Total agricultural labour force 1996-2007 440.0 420.0 400.0 L a b o u r fo r c e (th o u s a n d s ) 380.0 360.0 340.0 320.0 300.0 June 1996 June 1997 June 1998 June 1999 June 2000 June 2001 June 2002 June 2003 June 2004 June 2005 June 2006 June 2007 45 Source: Defra 2007 Labour force statistics. York Dec 2007
Farmers (E+W) f-t/p-t, 1998-2007 Numbers of Principal farmers, partners, directors & spouses 1998-2007 by working patterns 140.0 120.0 100.0 N um bers of farm ers (thousands) 80.0 full-time (more than 39hrs/w eek) part-time (less than 39hrs/w eek) 60.0 40.0 20.0 0.0 June 1998 June 1999 June 2000 June 2001 June 2002 June 2003 June 2004 June 2005 June 2006 June 2007 46 Source: Defra 2007 Labour force statistics. York Dec 2007
Food sector employment trends, GB 2000-06 source: Defra FdStatsPockBk 2007 p22 47
GB food sector employment: p-t/f-t, 2006 Q4 source: Defra FdStatsPockBk 2007 p23 48
UK Gross value added in food chain, 2002-05 Source: Defra Food Stats Pocketbk 2007 p12 49
What is land for? Return of an old policy question 50