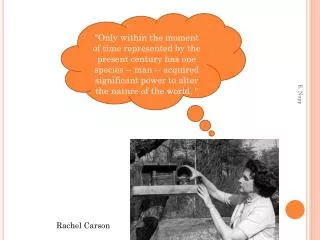


Rachel Carson
E N D
Presentation Transcript
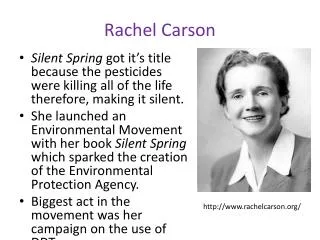
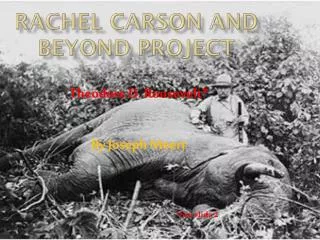
When Rachel Carson published Silent Spring in 1962, she was viciously attacked. Huge sums of money were spent to discredit her. She was called “an ignorant and hysterical woman who wanted to turn the earth over to the insects.” While her scientific methods were problematic, her message about the environment as an interrelated organic system struck a popular nerve. The smear campaign backfired. Silent Spring sparked a revolution in government environmental policy and became instrumental in creating a new ecological consciousness.
H Cl Cl C Cl Cl C Cl Dichlorodiphenyltrichloroethane DDT DDT was banned for use in the US on January 1, 1973. DDT was a suspected carcinogen DDT was known to be accumulating in the lipids of Bald Eagles interfering with reproduction
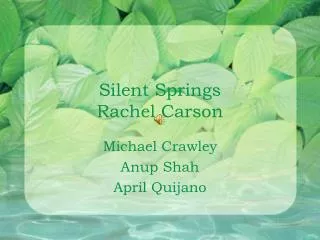
Silent Spring The Video
Sustainability Stewardship of the world’s natural resources in a manner that meets the needs of the present without compromising the ability of future generations to meet their needs. Development that meets the needs of the present without compromising the ability of future generations to meet their own needs. Brundtland Commission – 1987 Our Common Future Webster’s Ninth Collegiate Dictionary defines needs as – of necessity vs. wants – something wanted or desired
Sustainability Population Resources Consumption Three legged stool Consumption – the rate of use of natural resources. Population – the growth of the human population Resources – air, land, water, biota
Ecological Footprint • One way to measure consumption is to calculate how much land/sea area is required to support the consumption of an individual in a country (ecological footprint). • If a country’s per person footprint is multiplied by its population, and that result is larger than the resources of that country, then the country is living beyond its means and must take resources from another country.
The footprint of an individual in the U.S is 23.2 acres (an acre is slightly smaller than a football field). • World average ecological footprint is 6.7 acres per person, a sustainable footprint is 5.2 acres per person.
Footprint Measures • The ecological footprints given here are based on six main categories. • Arable land for cultivation of food, animal feed, fiber, oil crops, and rubber • Pasture- Grazing land for producing meat, hides, wool, and milk • Forest for harvesting timber, fuelwood, and wood fiber for paper • Sea space – for catching fish (93 million tons) • Built-up land for accommodating infrastructure for housing, transportation, and industrial production • Direct CO2 emissions from fossil fuels; indirect emissions for products manufactured abroad; gas flaring; cement production and tropical fires
density dependent regulation Maximum Sustained Yield Yield Fecundity 93 million tons Population Density Females Catch per Unit Effort
• The ecological footprint of a person in India is 2.2 acres, for the US it is 23.2 acres. The per person footprint of someone living in the US is 10.5 times larger than that of a person living in India. • The impact of a country on the Earth’s resources can be measured by multiplying the per person ecological footprint times the countries population density. • The ecological footprint of a person in India is 2.2, its population is 1,147,995,900 billion. 2.2 x’s 1,147,995,900 is 2,525,590,980. The ecological footprint of a person living in the US is 23.2 acres times 303,824,650 is 7,048,731,880. The impact of the people in the US on the world’s resources is 2.79 times greater than that of a person living in India. The US is deficit in resources and must take from someone else.
Population Density (2008) • China – 1,330,044,600 • India – 1,147,995,900 • USA – 303,824,650 • Indonesia – 237,512,36 • Brazil – 191,908,600
2007 Global Footprint Network, Mathis Wackernagle: “The United States has one of the largest footprints per person world wide and it would take about 6 planets like Planet Earth to support the world population if everybody assumed current American consumption patterns.” “We have met the enemy and he is us!” Pogo Used by Walt Kelly on a 1970 poster for the first earth day
John Mitchell AG- Convicted and imprisoned 1975 for role in the break-in at Watergate J. Edgar Hoover cross dressing Director of the FBI Spiro T. Agnew VP – Forced to resign for accepting bribes. Nixon administration 1969-1974
Population when births > deaths • World population increases • Those countries with the highest fertility rates (the number of children born per woman in her lifetime) are: • Mali 7.34 Somalia 6.6 • Niger 7.29 Afghanistan 6.58 • Uganda 6.81 • U.S. 2.1, Hong Kong 1.0, Taiwan 1.13, South Korea 1.2, Japan 1.22, Spain 1.3, Italy 1.3, European Union 1.5 • Note: the only recognized and independent country that is missing from this list is Vatican City. • A total fertility rate of 2.1 is known as the replacement fertility since in the long run if the population will stabilize at this rate. • http://www.nationmaster.com/index.phpaccessed 1/2009
A total fertility rate of 2.1 will not immediately result in a stable population with zero growth • Death rate may fall • If a population has many young people in it that are or will be having young the population will continue to increase even if the families limit themselves to 2.1 children. • Depending on the number of young in a population it may take 20 years to a century to stabilize so that there is no net growth. • Currently there is a net increase of approximately 2.44 people per second in the world! (Based on 2008 data) • The thing that is grossly wrong with this is that it seems to think that the only important specie on Earth is Homo sapiens
Resources • Land, air, water, biota • Water • Quantity • Surface waters including the oceans • Freshwater • Fossil aquifers • Alluvial aquifers • Rivers, streams • Lakes, Reservoirs, Ponds The percent of the Earth that is covered by water is _______ 97% is salt water, <3% is freshwater. 70%
Water Resources • Quality • Aquatic life • Human consumption
As more and more water is withdrawn from rivers, streams, lakes, and aquifers to feed thirsty fields, and the voracious needs of industry and escalating urban demands, there is often little left over for aquatic ecosystems and the wealth of plants and animals they support. Currently humans expropriate 54% of all available freshwater from rivers, lakes, streams, and shallow aquifers. Projected levels of population growth in the next 25 years alone are expected to increase the human take of available freshwater to 70%. As a global average, most freshwater withdrawals-69%- are used for agriculture, while industry accounts for 23% and municipal use (drinking water, bathing and cleaning, and water plants and grass) just 8%.
The competition for water is intense. According to Sandra Postel, Director of the Global Water Policy Project, it takes about 1000 tons of water to grow 1 ton of grain, which has a market value of $200, or if used for industrial products a value of $10,000 - $20,000. Water used in industry creates more jobs than in farming, increasing pressures to shift scarce supplies away from agriculture. It is cheaper to import grain and use water for industrial purposes.
As the number of people in water stressed countries climbs towards 3 billion, competition for water will spread across borders through the global grain trade as more countries try to import enough grain to fill their food gaps. Whether the U.S., Western Europe, and other food exporters will be able to satisfy these demands is only half the issue. Equally important is whether importers—primarily poor nations of South Asia and sub-Saharan Africa—can afford to buy the grain they need.
Destruction of habitat is the largest cause of biodiversty loss in almost every ecosystem, from wetlands and estuaries to prairies and forests. But biologists have found that the brunt of current plant and animal extinctions has fallen disproportionately on those species dependent on freshwater and related habitats. One fifth of the world’s freshwater fish –2,000 of the 10,000 species identified so far– are endangered, vulnerable, or extinct. In North America, the continent most studied, 67 percent of all mussels, 51 percent of crayfish, 40 percent of amphibians, 37 percent of fish, and 75 percent of all mollusks are rare, imperiled, or already gone. The global decline in amphibian populations may be the aquatic equivalent to the canary in the coal mine.
Pollution is also exacting a significant toll on freshwater and marine organisms. For instance, scientists studying beluga whales swimming in the contaminated St. Lawrence Seaway that connects the Atlantic Ocean to America’s Great Lakes found that the cetaceans have dangerously high levels of PCBs in their blubber. In fact, the contamination is so severe that under Canadian law the whales actually qualify as a toxic waste.
Orca facts: Adult weight: 3,000 to 12,000 lbs Adult length: 16 to 32 feet Lifespan: about 50 yrs females, 30 years males; male orcas carry their contaminant body burden their entire lives. Females pass a lifetime dose of the contaminants to their first born calves. Speed: up to 30 mph Habitat: all oceans Calving: every 3 to 5 years, but intervals sometimes to 10 years. Social structure: Killer whales live in pods. Orcinus orca In the Pacific Northwest, they are divided into transients and residents that do not interact and have different lifestyles. Diet: About 200 lbs of meat a day, residents eat fish, transients eat marine mammals mostly seals. Population off of British Columbia: 84 residents and about 220 transients. Declining populations? Nature lovers, declining salmon populations, contamination.
PCBs – polychlorinated biphenyls block the formation of vitamin A. Calves are hit with a large dose in their mother’s milk just at the time they need vitamin A to develop normally. PCBs do not cause outright death. But extensive laboratory animal experiments and captive feeding studies of seals show contamination can weaken immune systems, hamper reproduction, and cause skin disorders and subtle changes in physiology. The study showed that PCB levels in the fat of transient males averaged 251 ppm. In southern pods, levels were 146 ppm. Humans average less than 1 ppm. This means that these animals are 400 to 500 times more contaminated than humans. PCBs were banned from use in the US in 1977.
On March 20, 2000 a group of monkeys, driven mad with thirst, clashed with desperate villagers over drinking water in a small outpost in northern Kenya near the border with Sudan. The Pan African News Agency reported that eight monkeys were killed and 10 villagers were injured in what was described as a fierce two-hour melee. The fight erupted when relief workers began dispensing water from a tanker truck. Locals claimed that a prolonged drought had forced animals to roam out of their natural habitats to seek life-giving water in human settlements. The monkeys were identified as generally harmless vervets.
The most striking example of human water demands destroying an ecosystem is the nearly complete annihilation of the 64,500 square kilometer Aral Sea, located in Central Asia between Kazakhstan and Uzbekistan. Once the fourth largest inland sea in the world, it has contracted to half its size and lost three quarters of its volume since the 1960s when its two feeder rivers—the Amu Darya and the Syr Darya-were diverted to irrigate cotton fields and rice patties. For a long time the, the ecological impact of the sea and surrounding area were largely hidden from public view. The once-thriving fishing industry that depended on the water is all but gone. Some 20 of the 24 fish species there have disappeared.
The fish catch which totaled 44,000 tons per year in the 1950s and supported 60,000 jobs dropped to zero. Another apparent consequence of the dried-up sea is a host of human illnesses. A high rate of throat cancer is attributed to dust from the drying sea. Each year winds pick up 40 million to 150 million tons of a toxic dust-salt mixture from the dry sea bed and deposit them on the surrounding farm land, harming or killing crops. The low river flows have concentrated the salts and toxic chemicals, making water supplies hazardous to drink and contributing to disease. In the northwest Republic of Uzbekistan, the infant mortality rate is the highest in the former in the former Soviet Union. The former fishing center, Muynak is now landlocked some 30 km (18 miles) from the water. Less than 25 years ago Muynak was a seaport.
Lake Chad, too, has shrunk—to one-tenth its former size. In 1960, with a surface area of 25,000 square kilometers, it was the second-largest lake in Africa. When last surveyed, it was down to only 2,000 square kilometers. And here, too, massive water withdrawals from the watershed to feed irrigated agriculture have reduced the amount of water flowing into the lake to a trickle, especially during the dry season. Although water has been flowing into the lake from its rivers over the past decade, the lake is still in serious ecological trouble. The lake’s fisheries have more or less collapsed from over-exploitation and loss of aquatic habitats as its waters have been drained away. Though some 40 commercially valuable species remain, their populations are too small to be harvested commercially.
It’s not just “over there” where there are problems….. The two key treaties that divide the Colorado River water among seven states and Mexico allocate more water than the river actually carries in an average year—a mistake that occurred because the river’s annual flow was determined in an unusually rainy period. As a result virtually no fresh water flows through the Colorado delta and into the Sea of Cortez in an average year. The Colorado delta in northern Mexico, and the native Indian communities that live there, have been decimated. Had the treaty designers set aside fresh water to maintain this critical downstream ecosystem, they might have prevented substantial ecological and social harm. “You know the price of water when the well runs dry.” – Poor Richards Almanac “Whiskey’s for drinking, water’s for fighting about.” Mark Twain
The Ogallala is being pumped down at a rate of 1 meter per year and being recharged at a rate of 1 cm per year. Let’s see ground water pumped to produce corn, to feed to cattle in feed lots to make burgers for? What was that figure… the percent of loss in energy at each transfer in the food chain is ? 90%
The Rio Grande no longer consistently flows to the Gulf of Mexico. The River dried up in Big Bend in 2002.
How Does a City Earn The Right To Display This Sign?
How many of you drink bottled water? How many of you drive? How many of you think the price of gasoline is too high? If a 20 ounce bottle of Dasani costs a $1.00 how much does a gallon of Dasani cost? There are 128 oz in a gallon, how about $6.40 per gallon. Where does Dasani come from?
Toxicologists are guided by principles Principle 1 • In terms of measuring chemicals - you only find what you are looking for, and only if it is present in sufficient quantity to be detected by the method used to measure it.
Do you remember in the Silent Spring what the biochemist who was doing the work that the mouth piece was basing his statements on?
Water Facts • Percent share of all water on Earth that is freshwater 2.5 • Percent share of all freshwater that is frozen in glaciers and polar ice caps 70 • Percent share of all freshwater that is available for human use <1 • Average annual per-capita freshwater consumption, North America 1,851,170 Liters • Average annual per-capita consumption, Africa 254,944 Liters • Population world-wide without access to secure water supplies 1.1 billion • Population without access to adequate sanitation 2.6 billion • Annual deaths attributed to dirty water and poor sanitation 1.6 million • Annual global consumption of bottled water, liters 154 billion • Percent share of bottled water that is actually tap water 40% • Annual global spending on bottled water US$ 100 billion • Annual global spending on clean water and sanitation US$ 15 billion • Number of people that are living in countries that are over pumping • groundwater 3.3 billion
Principle 2 • The dose makes the poison! Paracelsus (1493-1541) is credited with this dictum when he wrote, “All substances are poisons, there is none which is not a poison. The right dose differentiates a poison and a remedy.” Exposure is the magnitude, duration, and frequency with which organisms interact with biologically available toxicants.
On average, a penny minted from1983 on contains approximately 59,500 ug of copper and 2,420,000 ug of zinc (both of which are essential elements). Needless to say that much copper and zinc is sufficient to cause significant damage to fish living in most fountains and backyard coy pools. Yet, when we toss these pennies into this aquarium the fish seems to be perfectly okay… How can this be? This particular penny is estimated to be worth $500,000.
Exposure is the magnitude, duration and frequency with which and organism interacts with biologically available toxicants. • So, just because you measure something in the environment it does not mean it is toxic.
Principle 3 • “No instrument has yet been devised that can measure toxicity. Chemical concentrations can be measured with an instrument but only living material can be used to measure toxicity.” • John Cairns, Jr. and D.I. Mount, 1990 • Environmental Science and Technology
The point is living material i.e., biological monitors (biomonitors) need to be used to measure toxicity. Biomonitors are the only things that integrate the totality of their environment. However, the biomonitors do not, for the most part, tell you directly what is causing the toxicity. Biominitors tell you only that toxicity is occurring or has occurred. Physical and chemical measures ultimately tells us what is causing the toxicity. Therefore, both biological and physical/chemical measures need to be used in ambient biomonitoring. Tasters Canary in the Coal Mine
Principle 4 Wherever you go you need to know