Download
1 / 30
300 likes | 425 Views
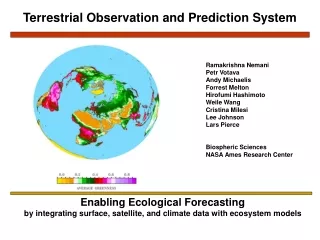
Terrestrial Observation and Prediction System. Enabling Ecological Forecasting by integrating surface, satellite, and climate data with ecosystem models. Ramakrishna Nemani Petr Votava Andy Michaelis Forrest Melton Hirofumi Hashimoto Weile Wang Cristina Milesi Lee Johnson Lars Pierce

E N D
Terrestrial Observation and Prediction System Enabling Ecological Forecastingby integrating surface, satellite, and climate data with ecosystem models Ramakrishna Nemani Petr Votava Andy Michaelis Forrest Melton Hirofumi Hashimoto Weile Wang Cristina Milesi Lee Johnson Lars Pierce Sam Hiatt Biospheric Sciences NASA Ames Research Center
What is Ecological Forecasting? • Ecological Forecasting (EF) predicts the effects of changes in the physical, chemical, and biological environments on ecosystem state and activity.
Short-term Monitoring and Forecasting Irrigation requirements Sacramento river flooding, California Based on weather forecasts, conditioned on historical ecosystem state Days
Mid-term/Seasonal Forecasts of water resources, fire risk, phenology ENSO-Rainfall over U.S El Nino La Nina Based on ENSO forecasts Weeks to months
Long-term Projected changes Based on GCM outputs Decades to centuries
A common modeling framework Monitoring Modeling Forecasting Multiple scales Predictions are based on changes in biogeochemical cycles Nemani et al., 2003, EOM White & Nemani, 2004, CJRS
Fluxnet Weather network Access to a variety of observing networks Soil moisture network Streamflow network
Access to a variety of remote sensing platforms Integration across Platforms, Sensors, Products, DAACs ..Non-trivial
Ability to integrate a variety of models Biogeochemical Cycling Crop growth/yield Pest/Disease Global carbon cycle Prognostic/diagnostic models
Ability to work across different time and space scales Hours Years/Decades Days Weeks/Months Weather/Climate Forecasts at various lead times downscaling
Research & Applications of TOPS Predictions are based on changes in biogeochemical cycles Nemani et al., 2003, EOM White & Nemani, 2004, CJRS
TMAX TMIN VPD PRECIP SRAD Gridded Weather Surfaces for California using nearly 700 weather stations daily Weather networks often operated by different govt. agencies and/or private industry. Rarely integrated because they are intended for different audiences. We specialize in bringing them together to provide spatially continuous data. maps come with cross-validation statistics
Daily satellite mapping of CA landscapes SNOW COVER VEGETATION DENSITY VEGETATION PHENOLOGY FIRE
California : Ecological Daily Nowcast at 1km [Feb/01/2006] Climate + Satellite Carbon and water cycles T P GPP ET 0 5 2.5 GPP (gC/m2/d) ET (mm/d) Biome-BGC Simulation models RAD Outputs include plant growth, irrigation demand, streamflow Salt water incursion, water allocation, crop coefficients
Mapping changes in global net primary production near real-time depiction of the droughts in the Amazon and Horn of Africa, May 2005 Near realtime monitoring of global NPP anomalies Running et al., 2004, Bioscience, 54:547-560
Irrigation Forecasts Irrigation Forecast for week of July 19-26, 2005 Tokalon Vineyard, Oakville, CA CIMIS Measured Weather Data through July 18, 2005 NWS Forecast Weather Data July 19-26, 2005 0 30 Forecast Irrigation (mm) 0 meters 1000 N Seasonal Fully automated web delivery to growers
Adapting TOPS for NPS needs • Understand the past • Monitor/Manage the present • Prepare for the future National Park Service
Ecosystem changes over continental scales understand the past
Interannual variability over Yosemite National Park understand the past Yosemite National Park
Watershed scale analysis of the anomalous 2004 using MODIS 250 data understand the past Yosemite National Park
Snow monitoring using MODIS Yosemite National Park monitor the present
Monitoring stream flow monitor the present Yosemite National Park
Vegetation monitoring using MODIS FPAR Yosemite National Park monitor the present
Monitoring land surface temperature using MODIS monitor the present Yosemite National Park
Impact of projected warming on Yosemite snow dynamics prepare for the future Yosemite National Park
Growing season dynamics under climate change Yosemite National Park prepare for the future
Projected trends in vegetation productivity prepare for the future Yosemite National Park
Summary Potential exists for providing ecological forecasts of various lead times Characterizing and communicating uncertainty remains a key issue We need: Improved in-situ monitoring networks. Rapid access to satellite data. Better linkages among models. Comprehensive framework for data management Improved delivery systems to decision makers