TBALL Data Collection
230 likes | 368 Views
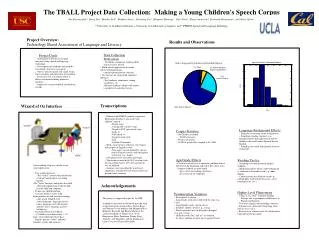
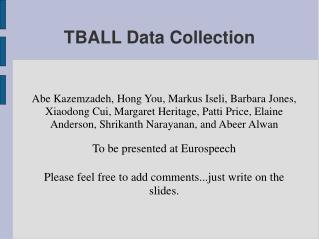
Abe Kazemzadeh, Hong You, Markus Iseli, Barbara Jones, Xiaodong Cui, Margaret Heritage, Patti Price, Elaine Anderson, Shrikanth Narayanan, and Abeer Alwan To be presented at Eurospeech Please feel free to add comments...just write on the slides. TBALL Data Collection. Presentation Overview.

TBALL Data Collection
E N D
Presentation Transcript
Abe Kazemzadeh, Hong You, Markus Iseli, Barbara Jones, Xiaodong Cui, Margaret Heritage, Patti Price, Elaine Anderson, Shrikanth Narayanan, and Abeer Alwan To be presented at Eurospeech Please feel free to add comments...just write on the slides. TBALL Data Collection
Presentation Overview • Introduction • Project Description • Motivation • Previous Research • Data Collection Methodology • Results/Observations • Transcription • Conclusion
Project Description • Automation of literacy assessment measures using speech and language technology. • Development of standards and methods for reliable, objective assessment. • One-on-one interaction with child, which leaves teachers with more time for teaching. • Focus on handling non-native speech. • Suppport for teacher feedback and database records.
Data Collection Motivation • Establishment a corpus for studying children and non-native speech. • Speech recognition applications for significant, but under represented populations. • Analysis of pronunciation variation. • Proving ground for the child-computer interface • Testing for hardware, animations, timing, vocabulary, etc. • Measuring children's ability with respect to grade level.
Previous Work • Many similar projects have focused on games and tutoring systems to help children with reading. • Our goals differ in that we aim to develop a system used for assessment, with feedback that goes to the teachers and records in a database for analysis. • Previous systems include LISTEN (CMU), EduSpeak (SRI), CU Animate (Colorado U.), and Watch Me Read (IBM).
Data Collection Methodology Overview • Wizard of Oz interface. • Description • Database • Accomodations for children • Recording setup. • Recording materials.
wizard of Oz (WOZ) Interface: Description • The tool for collecting data was designed with similar specifications as our target system. • An operator controlled the timing and difficulty level of stimuli: picture, color, letter, number, word, and sentence. • Picture and color stimuli allowed us to obtain data from preliterate children. • Another operator introduced the system to the child and gave instructions according to a fixed protocol
wizard of Oz (WOZ) Interface: Description, cont'd • The operator that gave the child instructions walked each child to and from his/her classroom and sat next to the child during the testing. • The operator controling the WOZ interface sat behind the monitor that presented the stimuli. • This operator was out of the child's view, but not hidden, as in standard WOZ experiments. This prevented the child from becoming suspicious or distracted by sensing a hidden person.
wizard of Oz (WOZ) Interface: Description, cont'd • If the child missed more than three stimuli, a new test was begun. • Testing lasted no longer than 20 min. per child.
wizard of Oz (WOZ) Interface:Database • The interface was connected to a database that stored child demographic data and recorded speech. • Age, grade, English development level, native language, language used at home, language used with friends, parents' native languages, and parents birthplaces.
wizard of Oz (WOZ) Interface:Accomodating Children • Stimuli were presented with cartoon animations. • Younger children enjoyed the animation, while older kids got bored due to the slowed pace. • Before starting the data collection at each school, the WOZ operators were introduced in each classroom and children were given the chance to ask questions. • This helped gain rapport with the children and made them less apprehensive and more enthusiastic.
Recording Setup • A laptop computer was used to run the WOZ interface. • A second LCD monitor was used to present the stimuli. • Children's speech was recorded to harddrive at 44,100 Hz. • Close-talking mic minimized the many evironmental sources of noise. • Recordings were done in classrooms, offices, or storage rooms. • ~15 children or ~1.9 hrs total speech recorded per day
Recording Materials • Stimuli paralleled the items from the testing battery of our target system. • For early readers: picture and color naming, number and letter reading • Many pictures had responses that we had not anticipated • Word lists and sentences for each grade level • Through planning and experience, we settled on a routine of testing. • In the beginning of the school year it was harder to anticipate the children's abilities.
Results/Observations:Overview • Stats • Age/grade effects. • Language background effects. • Pronunciation variation. • Reading tactics. • Higher level phenomena.
Results Stats • We recorded 256 children • 69% native Spanish, 24% native English, 5% native both (2% other) • 13 GB/40 hrs of speech data • 30,000 utterances
Age/Grade Effects • Position within a school year is important • Lower performance and more variability in the fall. • Younger children were more timid • Perhaps b/c less social experience in school, not comfortable with reading, or less exposure to computers
Language Background Effects • Difficulty associating a word with pictures. • Sometimes reading sentences were performed better than isolated words or pictures with children who could read well in Spanish, but not English. • Sounding out words with Spanish letter-to-sound rules
Pronunciation Variation • The read speech tended to be slower • Long breaks in fricatives followed by stops (eg, s-tart). • Longer liquids, nasals, and fricatives (which may become syllabic for liquids and nasals). • Syllables become more spread out (eg, a-long). • Final consonants may be delayed or droped (eg, par-t and par-). • “an” and “am” were difficult • Perhaps b/c these words are not used in isolation or b/c the vowel_consonant syllable structure is marked. • Speaking with an exaggerated voice.
Reading Tactics • Sounding out words generally helped the children but slowed down the pace of testing. • Words mispronounced when a subword portion is confused with another word. • Eg, once pronounced like “on” or using pronounced like “us”. • Confusion with the different sounds an orthographic symbol may have: “now” pronounced like “no”.
Higher-level Phenomena • Using “a, an, some” in picture naming. • Perhaps due to the grammatical differences between English and Spanish. • Verb tense changes when reading sentences. • Formation of contractions from long form (but not the otherway) • Reanalysis of sentences after the child realizes he/she has made a mistake.
Transcriptions • ARPABET symbols enhanced to represent phenomena peculiar to non-native and children's speech. • Dental stops • Unaspirated voiceless stops • Negative VOT (pre-voiced) stops • Lispy /s/ • Glottalized t • Long frication of /f/ • Trill • Syllabic sonorants
Transcriptions • With vowels, it was more difficult to enumerate all the possible variations. • We defined a convention to create new vowel symbols based on the two nearest, already defined vowels, with the higher coming first • Eg, a vowel that sounds between a /iy/ and an /ih/ would be /iyih/
Transcriptions • Three transcribers, the average inter-transcriber agreement was 82% at the phone level. • 80 unaligned, phone-level transcriptions per hour • Sentences were transcribed by word-level alignment.