Download
1 / 1
10 likes | 136 Views
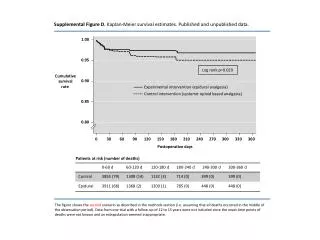
This figure presents Kaplan-Meier survival estimates comparing the cumulative survival rates of patients receiving epidural analgesia versus those receiving systemic opioid-based analgesia postoperatively. A log-rank test yielded a p-value of 0.029, indicating a statistically significant difference in survival. The cumulative survival rates are shown over a time frame up to 360 postoperative days, with data presented on patient risk and the number of deaths recorded. One long-term trial was excluded due to lack of precise death timing, which may affect the estimates.

E N D
Supplemental Figure D. Kaplan-Meier survival estimates. Published and unpublished data. 1.00 0.95 Log rank p=0.029 Cumulative survival rate 0.90 Experimental intervention (epidural analgesia) Control intervention (systemic opioid based analgesia) 0.85 0.80 0 30 60 90 120 150 180 210 240 270 300 330 360 Postoperative days Patients at risk (number of deaths) The figure shows the second scenario as described in the methods section (i.e. assuming that all deaths occurred in the middle of the observation period). Data from one trial with a follow-up of 12 to 15 years were not included since the exact time points of deaths were not known and an extrapolation seemed inappropriate.