Download
1 / 38
380 likes | 397 Views
This study evaluates the XBRL taxonomy for U.S. GAAP by applying it to recent financial statements, providing feedback for taxonomy improvement and encouraging alignment with reporting practices. The study explores issues of financial data aggregation and offers insights for firms, the XBRL consortium, and academia.

E N D
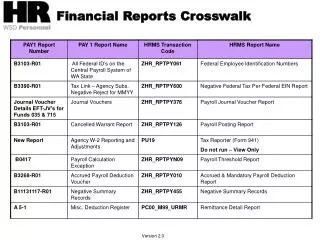
An Assessment of the XBRL Taxonomy for Financial Reports Matt Bovee, Mike Ettredge, Raj Srivastava, Liv Watson
Purpose of the Study • The purpose of this study is to field test the commercial and industrial XBRL taxonomy for U.S. GAAP by applying it to a sample of recent financial statements issued by firms.
Expected Benefits • Provide the XBRL consortium and other interested parties with feedback about the actual fit between the existing taxonomy and recent current practice as represented by the selected financial reports. • The XBRL consortium can use this feedback to modify the taxonomy if desired.
Expected Benefits (continued) • Encourage corporations issuing public financial reports to examine the correspondence between their reporting practices and the proposed taxonomy. • Alert accounting academics to an important development in financial reporting technology. The development of the XBRL taxonomy raises interesting issues, particularly with regard to aggregation of financial data.
The Sample • The sample was drawn from industries covered by the Fortune 1000. To date, seven firms have been selected from each of ten industries: Initial sample (7 x 10) 70 Less unusable firms - 3 Current sample 67
The C&I Taxonomy • Tables 1 through 10 of the paper show the XBRL taxonomy for Financial Reporting for Commercial and Industrial Companies (7/31/2000 release). • We show the taxonomy only for the Balance Sheet (BS), Income Statement (IS) and Statement of Cash Flows (SCF).
Interpreting the Tables • ‘Children’ accounts are shown above and to the right of their ‘Parent’ account: Convert. or Exchang. Debentures Convertible or Exchangeable Notes Convertible or Exchangeable Debt • The $ amount assigned to the Parent account equals the sums of the amounts for its Children.
Interpreting the Tables (continued) • Accounts titles shown in Italics indicate recommended additions to the taxonomy. Account titles shown in Bold indicate recommended changes to existing titles. • In these slides we use blue font to represent the taxonomy and green font to represent sample firms’ accounts.
Aggregation of Accounts • Aggregation refers to the extent that similar data items are combined for presentation in financial reports. For example, this presentation: Convert. or Exchang. Debentures Convertible or Exchangeable Notes Convertible or Exchangeable Debt is less aggregated than this presentation: Convertible or Exchangeable Debt
Aggregation of Accounts (continued) • Aggregation of accounting data involves loss of detail. • Within limits, managers can decide how far to aggregate control accounts when designing financial statements.The desired level of aggregation likely depends on managers’ incentives and on firm characteristics.
Aggregation and the Taxonomy • A financial reporting taxonomy such as XBRL embodies a particular aggregation of control accounts. Finely dis-aggregated data are incompatible with a brief taxonomy. • Like any taxonomy, XBRL imposes limits on the level of data aggregation and dis-aggregation that a firm can employ without modifying the taxonomy.
Missing Tags and Firm-Specific Items • In numerous instances, the sample firms’ accounts are more dis-aggregated than the (unmodified) taxonomy permits. • In such instances we tried to decide whether the accounts in question represented firm-specific items that do not justify a proposed new XBRL tag, or represented XBRL tags that should exist, but do not.
Example Missing Tag: Balance Sheet • Peoplesoft Inc. (12/31/1999) disclosed among its liabilities: Long-term deferred revenues • The XBRL taxonomy provides a tag for ‘Deferred Revenue’ among the current liabilities, but no corresponding tag for a non-current liability.In table 4 we recommend adding this tag: Deferred Revenue and Income
Example Missing Tag: Income Statement • A unique feature of the Income Statement is that many missing tags consisted of earnings subtotals rather than individual revenues or expenses. • Dana Corp., for example, presented the following item in its 1999 IS: Income before minority interest and equity in earnings of affiliates
Example for IS, continued • The XBRL taxonomy includes tags for both ‘Minority Interest, Net of Tax’ and ‘Equity in Income (Loss) of Unconsolidated Affiliates, Net of Tax’ (as children of ‘Non-Operating Income (Expense’)). However, the preceding earnings total in XBRL is ‘Operating Profit,’ not ‘Income before Minority Interest and Equity in Earnings of Affiliates.’
A Possible Solution? • One possibility is suggested by the IS of Oshkosh Truck Corp. (9/30/2000). That IS reports an item: Income before items noted below • Perhaps the XBRL taxonomy should include a ‘wild card’ tag such as this, that could be used with any firm-generated subtotal that does not fit the existing taxonomy.
Example Firm-Specific IS Item • The 1999 IS of IBM Corp. provides a good example of items classified as firm specific. It includes revenues and costs broken out by business segments: Hardware Global Services Software Global Financing Enterprise Investments/Other
Example Missing Tag: Cash Flows • The XBRL taxonomy allows a firm to reconcile net income to operating cash flows in the SCF by ‘adding back’ a tag titled ‘Depreciation and Amortization’. Alternatively, one can add back either or both of two children accounts: (1) ‘Depreciation’ and (2) ‘Amortization’. A number of sample firms, however, desire to distinguish between amortization of goodwill and of other intangibles.
Example for SCF, continued • Albertsons’ Inc. SCF (2/3/2000) shows: Depreciation and amortization Goodwill amortization We recommend the following: Depreciation Goodwill Amortization Other Amortization
Grouped Items • Grouped items are accounts that violate the parent/child relations permitted by XBRL. Often a sample firm will disclose an account that can be mapped to two or more XBRL tags (i.e., the firm’s account represents a group of tags). However, these XBRL tags do not constitute the only children of the same parent tag. If they did, the firms’ account could simply be mapped to the parent tag.
Grouped Items Example: Balance Sheet • Xerox Corp., (12/31/1999) reports the following among its non-current liabilities: Deferred taxes and other liabilities
Grouped Items Example, continued The unmodified BS taxonomy in table 4 includes: Long Term Debt Deferred Income Taxes Etc. Other Non-Current Liabilities Non-Current Liabilities
Grouped Items Example, continued • Xerox’s item maps to two different XBRL tags: ‘Deferred Income Taxes,’ and ‘Other Non-Current Liabilities’. • Xerox’s item can’t be mapped to the parent tag ‘Non-Current Liabilities,’ because that parent tag has other children such as ‘Long Term Debt.’
A Possible Solution? • Perhaps the XBRL taxonomy should include a ‘wild card’ tag such as ‘Total for Items Noted Above’that could be used with any grouped item. For the example, this might result in a presentation such as: Amount Deferred Income Taxes - Other Non-Current Liabilities - Total for Items Noted Above $XXX
More about the SCF Taxonomy • The slides above assessed the level of data aggregation inherent in the XBRL taxonomy by comparing the taxonomy with firms’ published financial statements. • Next we employ a different approach by comparing the taxonomy’s data aggregation between financial statements. Below we compare the data aggregation embodied in the XBRL SCF taxonomy with the BS taxonomy.
Descriptive Statistics • To conclude, we present descriptive statistics about missing tags, grouped items, and firm-specific items broken out by financial statement, industry, etc.
Interpretation of Figure 1 • The large number of grouped items for the BS (and small numbers of missing and firm-specific items) suggest the BS taxonomy is more dis-aggregated than most firms desire. • The small number of grouped items for the SCF (and large numbers of missing and firm-specific items) suggest the SCF taxonomy is more aggregated than most firms desire. • The IS represents an intermediate case.
Interpretation of Figure 2 • The SCF generates the most exceptions in almost all industries. • The largest numbers of BS and IS exceptions are found in the entertainment and petroleum refining industries. • The taxonomy provides a better ‘fit’ for some industries than others. To see this, add together the three bars for each industry.
Interpreting Figure 3 • The entertainment and petroleum refining industries have large numbers of firm-specific items. • Petroleum refining also has large numbers of grouped items. • Missing tags are most numerous in the computer software industry.
Interpreting Figure 4 • Firms that currently use their Web sites most heavily for disseminating financial information (WSQ4 and WSQ5) have fewer exceptions than those using their Web sites least for this purpose (WSQ1 and WSQ2). • This is true for all three financial statements examined.
Interpreting Figure 5 • Firms that currently use their Web sites most heavily for disseminating financial information (WSQ4 and WSQ5) have fewer exceptions than those using their Web sites least for this purpose (WSQ1 and WSQ2). • This is true for all three types of exception examined.
Summary • This study should provide the XBRL consortium and other interested parties with feedback about the actual fit between the existing taxonomy and recent current practice as represented by the selected financial reports. • Based on this fit, we provide recommended changes to the taxonomy.
Summary • The XBRL consortium can use this feedback to modify the taxonomy if desired. The recommended changes would eliminate most exceptions. • An encouraging finding: Firms that are likely to be early adopters of XBRL (based on current use of Web sites) have financial reports that fit the taxonomy well.