Download
1 / 11
110 likes | 289 Views
Heater upgrade. Direct Digital Synthesis boards replace the original 13 analogue synthesizers. A standard EISCAT radar controller replaces a 1970’s microcompter and hardware for modulation and new 'eros' software allows great flexibility.

E N D
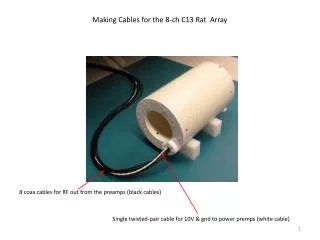
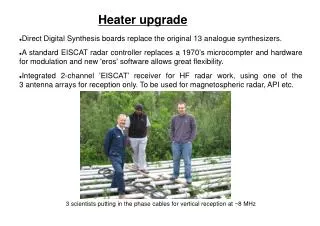
Heater upgrade • Direct Digital Synthesis boards replace the original 13 analogue synthesizers. • A standard EISCAT radar controller replaces a 1970’s microcompter and hardware for modulation and new 'eros' software allows great flexibility. • Integrated 2-channel ’EISCAT’ receiver for HF radar work, using one of the 3 antenna arrays for reception only. To be used for magnetospheric radar, API etc. 3 scientists putting in the phase cables for vertical reception at ~8 MHz
Heater upgrade all this is replaced....
by this... in the control room in the transmitter hall
X-mode heating is sometimes better than O-mode foF2 and fpump X-mode O-mode fpump=4.9 MHz From N. Blagoveshchenskaya, AARI, Russia, unpublished work
Löfås et al., 2009, showed that for X-mode heating at 4.04 MHz: “Electron temperature enhancements of the order of 300–400K were obtained. Numerical simulation of ohmic heating by the pump wave reproduces both altitude profiles and temporal dependence of the temperature modifications in the experiments” Profile of X-mode energy deposition from heater used for solution of the energy equation for October 17, 2006. Exponential fits to temperature rise and fall data (blue points) are shown in green. Results of the time dependent modelling of collisional Ohmic heating by the pump wave are shown in red.
Gustavsson et al. (unpublished) modelled another case of much stronger X-mode heating, showing the contributions of the various energy loss rates The altitude variation of electron energy loss rates shown in this panel for HF-heated Te with bold curves and background Te with thin curves. The corresponding Te profiles are shown in the right panel.
K. S. Kalogerakis et al.: Remote Oxygen Sensing by Ionospheric Excitation (ROSIE) The principal optical observable emission resulting from ionospheric modification (IM) experiments is the atomic oxygen red line at 630 nm, originating from the O(1D–3P) transition. Because the O(1D) atom has a long radiative lifetime, it is sensitive to collisional relaxation and an observed decay faster than the radiative rate can be attributed to collisions with atmospheric species. In contrast to the common practice of ignoring O-atoms in interpreting such observations in the past, recent experimental studies on the relaxation of O(1D) by O(3P) have revealed the dominant role of oxygen atoms in controlling the lifetime of O(1D) at altitudes relevant to IM experiments. we can demonstrate an approach to remotely detect O-atoms at the altitudes relevant to IM experiments, which we call remote oxygen sensing by ionospheric excitation (ROSIE) Relative Contribution to O(1D) Removal (%) Calculated relative contribution to O(1D) loss as a function of altitude by O, O2, N2, and radiative decay. These four processes are assumed to be the only pathways for O(1D) relaxation.
Havnes et al, (MS submitted, 2010) modelled HF-induced PMWE overshoot relaxation times. They conclude that photodetachment of the nanometer scale dust is the cause. The average overshoot curve for the 381 cases within the white dashed box. The relaxation time, starting 25 sec after the heater was switched off, was 60-70 sec. HF, 20s on every 2 min, 5.423 MHz, X-mode, 500 MW ERP
Why some PMSE modulation experiments work and others don't Routledge et al. (2009) show that, depending on the D-region electron density profile, the heating may be too low in altitude. The modelled electron temperature increases at the left, using measured electron densities from the VHF radar, show the results for a successful PMSE modulation experiment at the top and an unsuccessful one below. Using O-mode may also help reach higher altitudes.
Senior et al., 2010, use the cross-modulation technique to try to validate the model used to calculate the HF-induced electron heating in the D region. The model overestimates the change in absorption of the diagnostic wave by a factor of 1.5–2.5. It is suggested that the assumption that the electron distribution function remains Maxwellian during heating could contribute to this discrepancy. The diagnostic pulse begins at t = 0 and ends at t = Td. The disturbing pulse of length Th is emitted centred at t = th after alternate diagnostic pulses. The diagnostic echo received at time tr corresponds to the intersection of the diagnostic and disturbing pulses at altitude zi = c(tr − th)/2, the “interaction height”
Senior et al., 2010, Heating model results for Case 1. The change in diagnostic absorption per unit path length from the unheated to the heated ionosphere. The dashed lines show the propagation of the disturbing pulse. The electron temperature versus altitude and time.