Download
1 / 1
10 likes | 121 Views
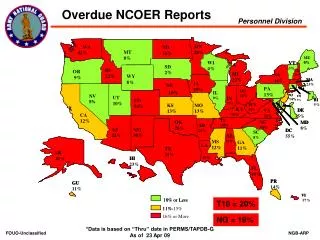
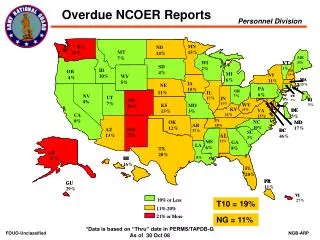
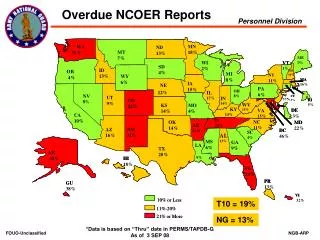
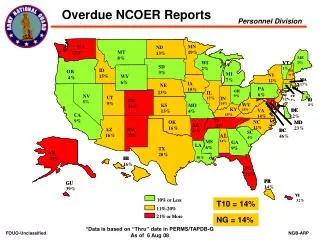
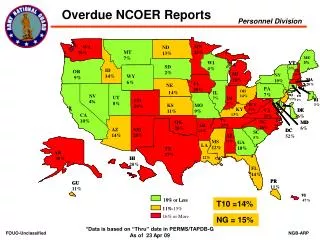
This report provides a detailed analysis of Non-Commissioned Officer Evaluation Reports (NCOER) data collected across various U.S. states as of April 2023. The data highlights the percentage of overdue reports, showing significant variation by state. Key trends have been identified, including states with the highest and lowest overdue percentages. Understanding these trends is crucial for military personnel management and evaluation processes, ensuring timely submission and processing of reports to maintain operational readiness.

E N D
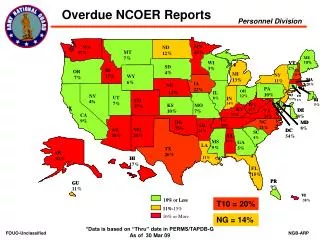
MN MN WA WA ND ND MT MT 25% 53% 39% 47% 30% 13% 46% 7% ME ME WI WI VT VT 5% 16% SD SD 10% 4% 29% 3% ID ID OR OR NH NH 39% 2% MI MI NY NY 36% 20% 40% 14% WY WY 9% 34% 18% 23% MA MA 28% 10% 6% 53% IA IA 20% NE NE PA PA 20% 34% 35% OH OH IL IL 25% 7% NV NV NJ NJ 25% 14% CT CT UT UT IN IN 7% 24% 11% RI RI CO CO 2% 4% 53% 8% 32% 17% 17% WV WV 3% KS KS MO MO 51% 29% KY KY DE DE VA VA 32% 32% 38% 11% 16% 9% CA CA 49% 13% 6% 29% 28% . . TN TN 10% 55% NC NC OK OK MD MD AR AR 45% 27% 26% 38% 21% 20% 6% AZ AZ NM NM DC DC 22% 42% SC SC AL AL 14% 17% 28% 20% 52% 5% 11% MS MS 18% 40% GA GA LA LA 12% 11% 10% 56% TX TX AK AK 49% 27% 12% 52% HI HI 39% 33% 20% FL FL 14% 42% PR PR GU GU 11% 11% VI VI 10% or Less 10% or Less 47% 11% 11% - - 15% 16% or More Overdue NCOER Reports 14% T10 =14% NG = 15% *Data is based on “Thru” date in PERMS/TAPDB-G As of 23 Apr 09