Download
1 / 36
360 likes | 473 Views
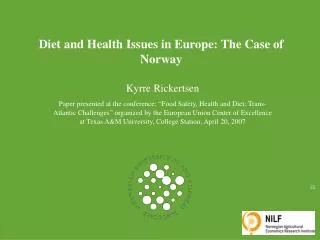
Diet and Health Issues in Europe: The Case of Norway. Kyrre Rickertsen Paper presented at the conference: “Food Safety, Health and Diet: Trans-Atlantic Challenges” organized by the European Union Center of Excellence at Texas A&M University, College Station, April 20, 2007. Overview.

E N D
Diet and Health Issues in Europe: The Case of Norway Kyrre Rickertsen Paper presented at the conference: “Food Safety, Health and Diet: Trans-Atlantic Challenges” organized by the European Union Center of Excellence at Texas A&M University, College Station, April 20, 2007
Overview • Briefly about the development of the Norwegian nutritional policy • Current nutritional policy (2007) • Targets • Strategies used to implement targets • Predicted effects of taxes and subsidies on the consumption of (based on joint work with Geir W. Gustavsen): • Vegetables • Milk • Sugar-sweetened carbonated soft drinks (SSCSD) • Candy Department of Economics and Resource Management
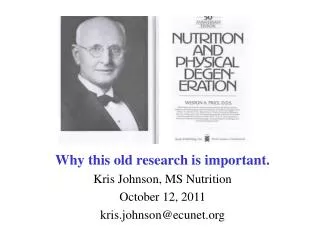
The Development of a Nutritional Policy • After World War II: Provide the population with a sufficient and nutritionally satisfactory diet • First country in the world with a nutritional policy. Established in 1975 in the document: “About Norwegian Nutritional and Food Security Policy” • Main nutritional objective: Reduce the intake of (saturated) fats and increase the intake of carbohydrates • Followed up with documents in 1981, 1993, and 2007 • These documents are joint policy documents involving (among others) the Department of Agriculture and the Department of Health with partly conflicting interests Department of Economics and Resource Management
European and US Diets around Year 2000Annual per Capita Consumption in kilograms/liters (imprecise disappearance data). Norwegian figures for 1980 in the parentheses • Kyrre Rickertsen: • Waste, etc means that these data do not directly measure consumption • Imports of processed foods may affect these data • May calculate fish differently in different countries (is the shell of the oyster included)? Department of Economics and Resource Management
Results of the Nutritional Policy (and Other Factors) • As intended, the intake of fats was reduced: • The consumption of whole milk was reduced from 143 liters to 43 liters • The annual death rate from cardiovascular diseases was reduced from 550 to 320 (per 100,000) for males and from 463 to 370 for females over the period 1980 to 2005 • As intended, the consumption of carbohydrates increased: • Grains and cereals (about 15%) and fruits and vegetables (about 10%) • Carbonated soft drinks (more than 100%), a not intended change! • Compared with other countries: • High consumption of: Fish, grains and cereals and milk • Low consumption of: Meat, fats and oils, fruits, and vegetables Department of Economics and Resource Management
WHO (Fact Sheet, 2005) Reports European Obesity Rates (BMI > 30) Department of Economics and Resource Management
Percentage of Population with BMI > 30 in the U.S. Department of Economics and Resource Management Source: Flegal et al., JAMA, Oct. 2002; Ogden et al., April 2006 Copied from Variyam (2006)
Percentage of Overweight Population (BMI > 25) by Country (OECD Health Statistics 2004 reported in Nayga, 2005) Department of Economics and Resource Management
Percentage of Population with BMI > 3040-42 Years Old • Female /Male • Currently about 15% of age group have BMI > 30 • Rapid increase since the early 1990s • About 1-2% of 15 to 16 years old have BMI>30 • Obesity rates about half among people with MSc as compared with people who have not completed high school • Diet, physical activities, (lack of sleep)? Department of Economics and Resource Management
Costs of Overweight and Obesity • Direct costs (preventive, diagnostic, and treatment) as well as indirect costs (lost wages due to illness and premature deaths) • The costs (including welfare losses) associated with obesity are estimated to be 0.5 – 1 percent of GDP in the Nordic countries. Corresponds to about US$ 250 per capita and year in Norway • Obesity consumes 2 – 8% of health care budgets in European countries (OECD, 2005, Fact Sheet) Department of Economics and Resource Management
Current Norwegian Nutritional Policy Stated in: “A Recipe for a Healthier Diet” Department of Economics and Resource Management
Health Issues and Food Consumption I • The document focuses on the average diet: • A direct link between the population’s average diet and the prevalence of diseases such as: type 2 diabetes, cardiovascular diseases, certain types of cancer and osteoporosis as well as other health problems • An indirect link between the populations average diet and obesity, which increases the risk for diseases such as cardiac infarction, stroke, cancer, type 2 diabetes, and muscular and joint diseases. The emphasis on this indirect link is new in the Norwegian debate Department of Economics and Resource Management
Health Issues and Food Consumption II • The document also focuses on the distribution of consumption and the diet of specific target groups: • People with unhealthy consumption in general • Children (to prevent unhealthy habits) • Older people (reduced food intake may result in inadequate diet) • Non-Western immigrants (high rates of obesity and diabetes 2) Department of Economics and Resource Management
The Official Quantitative Targets I • Average consumption: • Double the intake of fruits and vegetables • Increase intake of whole grain bread and fish • Distribution of consumption with a 20% increase in the number of: • People who daily consume vegetables (now about 63%) • People who daily consume fruits ( nowabout 61%) • People who consume fish at least once per week • Young people who daily eat breakfast Department of Economics and Resource Management
Kyrre Rickertsen: 1) Some transfats are naturally occurring in livestock products. Some like CLA may even be beneficial The Official Quantitative Targets II • Reduce average consumption of • Fats. Recommended level 30% of energy intake (now 34%) • Saturated fats. Recommended level <10% of energy intake (now 14%) • Transfats. Recommended level <1% (at recommended level) • Sugar. Recommended level <10% of energy intake (now 14%) • Salt. Recommended level <5 grams per day (now 10 grams) Department of Economics and Resource Management
The Official Quantitative Targets III • Distribution of consumption with a 20% reduction in the number of: • Children and young people who daily consume sweets and candies • People who daily consume sugar-sweetened soft drinks • People who get more than 10% of the energy intake from sugar (now more than 80% of children aged 4 – 11 years get more than 10% of the energy intake from sugar) • People who get more than 10% of the energy intake from saturated fats Department of Economics and Resource Management
What is Needed? A Policy Mix! • Information? • Campaigns are never well funded (typically less than 1 mill. $) • Regulation? • Transfats • Vending machines in schools • Mandatory labeling • Free provisions? • Fruits and vegetables in schools • Low-fat milk and high-quality drinking water in schools • School lunches? • Taxes and subsidies? Department of Economics and Resource Management
Five Strategies to Improve the Diet I • In general, none of the strategies are very likely to substantially change the diet • The strategies represent few specific actions • S 1: Increase the availability of healthy food • Co-operation with the food industry to develop and market healthy foods • Increase sales of subsidized fruits, vegetables and milk in public schools (by information encouraging the participation of more schools and more students in each school in such programs) • Encourage the counties and schools to “reduce the access to less healthy soft drinks” and “increase the access to water” • Encourage more healthy eating at workplaces Department of Economics and Resource Management
Five Strategies to Improve the Diet II • S 2: Increase the public information to improve consumers’ knowledge • Continue the work with a mandatory nutritional labeling system • Decide if Norway will follow EU-labeling rules • In general, TV advertising targeted directly towards children is not allowed for radio and TV channels broadcasting from Norway. But many foreign broadcasters are popular and can advertise according to their national laws • Evaluate if TV marketing and other marketing (Internet, magazines, stores, etc) for unhealthy foods aimed at children and youth should be further restricted by law. Currently they work on voluntary guidelines with the industry Department of Economics and Resource Management
Five Strategies to Improve the Diet III • S 3: Increase the scientific knowledge among health workers and other providing nutritional information • Education at different levels in the school system concerning health and nutrition should be improved • More basic nutritional research and public health research related to the effects of food consumption on health outcomes • S 4: Improve the local co-operation between public and private partners • Review guidelines for food in public institutions (e.g. kinder gardens, schools, homes for old people, jails, hospitals, etc) • S 5: Improve the preventive aspects in the public health services Department of Economics and Resource Management
What Is Missing:A Stronger Price Policy? • Taxes and subsidies: • Taxes or subsidies are not a part of the suggested strategies • From 2007, the value added tax (VAT) is 14% for food and beverages and 25% for most other goods • An additional (small) sugar tax (revenue about 180 mill $ in 2007) • Foods are also taxed and subsidized through a very complicated agricultural policy system with very high import tariffs. This policy results in high prices for domestically produced foods (healthy or unhealthy) Department of Economics and Resource Management
What Is Missing:A Better Labeling Policy • Current nutritional labeling system is not very informative neither for those asking for specific information nor for those who seek basic advises • Required to list the ingredients in declining order (the main ingredients listed first, etc). Voluntary to reveal the exact nutritional content • Have to list the nutritional content in nutritionally fortified foods • Have to list nutritional supplements and preservatives in the food • Can label a product as a “light” product if the energy content is reduced by at least 30% as compared with the original product Department of Economics and Resource Management
Kyrre Rickertsen: • Do not look at direct taxes of the ingredients. The costs of the ingredients are typically quite low in most unhealthy products (e.g. sugar in soft drinks) and extreme taxes would be needed • Also a problem with potential unhealthy substitutes (e.g corn syrup instead of sugar in soft drinks) Our Research (with Geir Wæhler Gustavsen) • Evaluate effects of removing or increasing the value added tax (VAT is currently 14%) on the purchases of healthy and unhealthy foods • Cross-sectional data from Norwegian purchase surveys • 1986 – 2001 (1997) • 15,700 – 20,500 households • Focus on households with low consumption of healthy products or high consumption of unhealthy products Department of Economics and Resource Management
Our Research • Quantile regressions are used • Quantiles are points on the cumulative distribution function of a random variable • A household that purchases at the θth quantile of the purchase distribution buys more than the proportion θ of households and less than the proportion (1-θ) • Thus at the 0.75th quantile, 75% of the households buy no more than does the specified household and 25% buys more Department of Economics and Resource Management
Vegetables Department of Economics and Resource Management
Effects of VAT Removal- Own-price elasticities are different in different quantiles- VAT removal would cost about $50 per household- Does not substantially increase purchases in low-consuming households. Will primarily benefit high-consuming households Department of Economics and Resource Management
Milk Department of Economics and Resource Management
Effects of VAT Removal-Own-price elasticities are different in different quantiles- VAT removal would cost about $48 per household- Increase purchases of low-consuming households but no significant effect in high-consuming households Department of Economics and Resource Management
Sugar-Sweetened Carbonated Soft Drinks (SSCSD) Department of Economics and Resource Management
Kyrre Rickertsen: 1) What does a 19 liters decrease on an annual basis correspond to in terms of weight gain per year? 2) Can we say that is is a small or trivial effect? Effects of Doubling VAT- Own-price elasticities are different in different quantiles- Predicted decreases among heavy drinkers are questionable (insignificant own-price elasticities)- Predicted significant decreases among light and moderate drinkers Department of Economics and Resource Management
Candy Department of Economics and Resource Management
Effects of Doubling VAT- Own-price elasticities are different in different quantiles- Will significantly reduce consumption in all the quantiles Department of Economics and Resource Management
Conclusions • The effects of taxes and subsidies vary across products • The effects of taxes and subsides are different among low-consuming and high-consuming households, i.e. QRs are useful Department of Economics and Resource Management
Conclusions: VAT removal I • Vegetables • Small or no effects on low-consuming households • Stronger effects on high-consuming households • Milk • Some effects among low-consuming households • No effects among moderate- and high-consuming households • Candy • Large effects among all households Department of Economics and Resource Management
Conclusions: VAT Removal II • SSCSD • Large effects except among really heavy drinkers (in the 0.90th and 0.95th quantiles) • More than a 10 liters annual reduction in consumption likely • Are the effects of a 10 liters reduction trivial? • In one year, the weight gain resulting from such a reduction is about 0.50 kg (or 1 pound) • But the weight gain adds up to about 5 kg over ten years Department of Economics and Resource Management
Thank you for your attention Department of Economics and Resource Management