Download
1 / 26
260 likes | 425 Views
ZERO WASTE ECONOMICS Think Globally, Pay Locally. Sound Resource Management Seattle, Washington, USA jeff.morris@zerowaste.com. I. In the Marketplace Recycling Dances to the Tune of Virgin Commodity Prices. Aluminum Ingot vs. Recycled Cans.

E N D
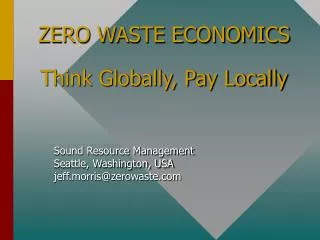
ZERO WASTE ECONOMICSThink Globally, Pay Locally Sound Resource Management Seattle, Washington, USA jeff.morris@zerowaste.com
I. In the MarketplaceRecyclingDances to the TuneofVirgin Commodity Prices
II. Recycling’s Societal Value Is Greater Than Its Marketplace Value
Calculating Recycling’s Environmental Value • Quantify Life-cycle Material, Energy and Pollutant Inputs and Outputs • Estimate Environmental Impacts of Inputs and Outputs • Estimate Economic Costs of Environmental Impacts, or Rank Impacts via Some Other Numerical or Qualitative Measure
III. Virgin-Content Products Use More Energy ThanRecycled-Content Products(Upstream Benefit of Recycling)
Energy Used for Resource Acquisition & Product Manufacturing
IV. Curbside Recycling Saves More Energy Than It Uses to Collect, Process and Market Recycled Materials
V. Curbside Recycling Saves More Pollution Than It Generates to Collect, Process and Market Recycled Materials
Pollution Reductions from Recycling • Avoided Pollution from Virgin Resource Extraction & Virgin-Content Manufacturing (upstream external benefits) • Minus: Pollution from Recycled-Content Manufacturing (upstream external costs) • Avoided Pollution from Garbage Collection, Transfer & Disposal (waste management external benefits) • Minus: Pollution from Curbside Collection, Processing & Shipping (waste management external costs)
WA Curbside Recycling vs. DisposalAcidification Potential Reductions
WA Curbside Recycling vs. DisposalEutrophication Potential Reductions
VI. Waste Management & External Environmental Costs Avoided by Recycling>Costs Incurred byCurbside Recycling
Net Externalized Environmental Benefit of Curbside Recycling • Avoided External Costs from: • Virgin-Content Products (pollution from virgin resource extraction & virgin-content manufacturing) • Garbage Collection, Transfer & Disposal (pollution from garbage management) • Less: Increased External Costs from: • Recycled-Content Products (pollution from recycled-content manufacturing) • Curbside Collection, Processing & Shipping (pollution from recyclables management)
Net Cost of Curbside Recycling • Curbside Recycling Collection, Hauling, Processing & Shipping Costs • Less Revenue & Avoided Garbage Costs: • Revenue from recyclables • Avoided Garbage Disposal Costs • Avoided Garbage Collection & Transfer Costs
Australian Kerbside Study: Recycling Costs Amount to Just 38% of Dollar Value of Net Environmental Benefits • Environmental Benefits: • 75% from upstream air & water pollution decreases • 21% from upstream land use reductions & future resource access improvements • 4% from global warming credits • 2% from reduced land use for landfills • Environmental Costs: • 2% from increased truck traffic
WA Curbside Recycling vs. Landfilling: Net Internalized Costs vs. Net Externalized Benefits
WA Curbside Recycling vs. Waste-to-Energy: Net Internalized Costs vs. Net Externalized Benefits
Sulfur Dioxide Emissions Allowance Trading (average monthly prices)