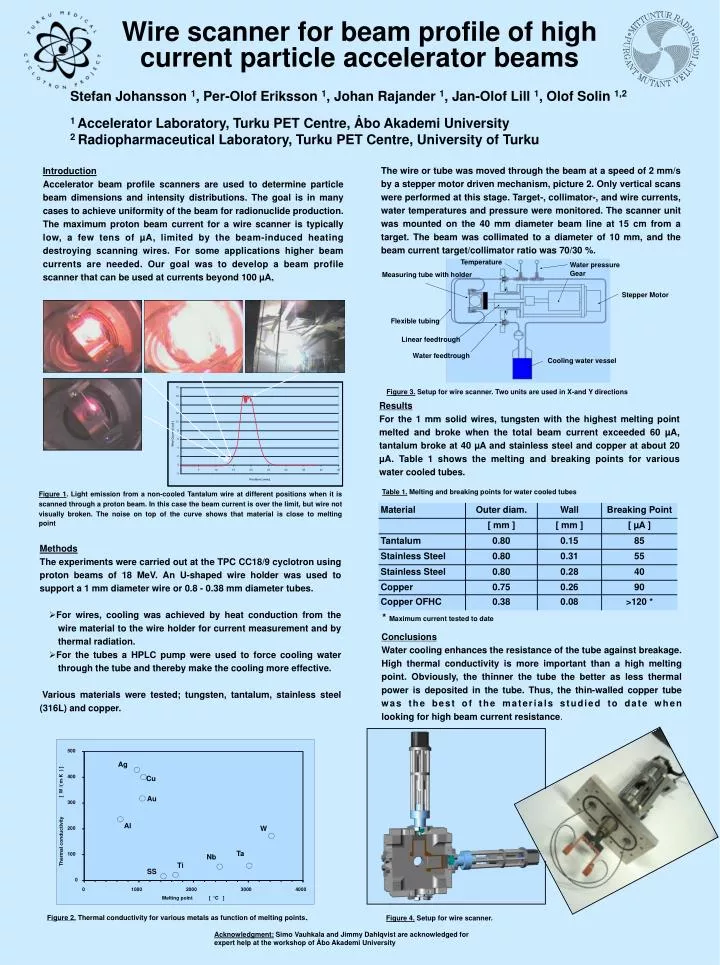

Development of High-Current Beam Profile Scanner for Particle Accelerators
E N D
Presentation Transcript
18 16 14 500 12 Ag 10 ) ] 8 400 Cu Wire Current [ uA ] m·K 6 /( W 4 [ Au 2 300 0 0 5 10 15 20 25 30 35 40 45 -2 Al Position [ mm ] W 200 Thermal conductivity Ta 100 Nb Ti SS 0 0 1000 2000 3000 4000 Melting point [ °C ] Wire scanner for beam profile of high current particle accelerator beams Stefan Johansson 1, Per-Olof Eriksson 1, Johan Rajander 1, Jan-Olof Lill 1, Olof Solin 1,2 1 Accelerator Laboratory, Turku PET Centre, Åbo Akademi University 2 Radiopharmaceutical Laboratory, Turku PET Centre, University of Turku The wire or tube was moved through the beam at a speed of 2 mm/s by a stepper motor driven mechanism, picture 2. Only vertical scans were performed at this stage. Target-, collimator-, and wire currents, water temperatures and pressure were monitored. The scanner unit was mounted on the 40 mm diameter beam line at 15 cm from a target. The beam was collimated to a diameter of 10 mm, and the beam current target/collimator ratio was 70/30 %. Introduction Accelerator beam profile scanners are used to determine particle beam dimensions and intensity distributions. The goal is in many cases to achieve uniformity of the beam for radionuclide production. The maximum proton beam current for a wire scanner is typically low, a few tens of µA, limited by the beam-induced heating destroying scanning wires. For some applications higher beam currents are needed. Our goal was to develop a beam profile scanner that can be used at currents beyond 100 µA. Temperature Water pressure Gear Measuring tube with holder Stepper Motor Flexible tubing Linear feedtrough Water feedtrough Cooling water vessel Figure 3. Setup for wire scanner. Two units are used in X-and Y directions Results For the 1 mm solid wires, tungsten with the highest melting point melted and broke when the total beam current exceeded 60 µA, tantalum broke at 40 µA and stainless steel and copper at about 20 µA. Table 1 shows the melting and breaking points for various water cooled tubes. Table 1. Melting and breaking points for water cooled tubes Figure 1. Light emission from a non-cooled Tantalum wire at different positions when it is scanned through a proton beam. In this case the beam current is over the limit, but wire not visually broken. The noise on top of the curve shows that material is close to melting point • Methods • The experiments were carried out at the TPC CC18/9 cyclotron using proton beams of 18 MeV. An U-shaped wire holder was used to support a 1 mm diameter wire or 0.8 - 0.38 mm diameter tubes. • For wires, cooling was achieved by heat conduction from the wire material to the wire holder for current measurement and by thermal radiation. • For the tubes a HPLC pump were used to force cooling water through the tube and thereby make the cooling more effective. • Various materials were tested; tungsten, tantalum, stainless steel (316L) and copper. * Maximum current tested to date Conclusions Water cooling enhances the resistance of the tube against breakage. High thermal conductivity is more important than a high melting point. Obviously, the thinner the tube the better as less thermal power is deposited in the tube. Thus, the thin-walled copper tube was the best of the materials studied to date when looking for high beam current resistance. Figure 2. Thermal conductivity for various metals as function of melting points. Figure 4. Setup for wire scanner. Acknowledgment: Simo Vauhkala and Jimmy Dahlqvist are acknowledged for expert help at the workshop of Åbo Akademi University