Comprehensive Guide to GIS Advanced Techniques and Tools
Explore advanced Geographic Information Systems (GIS) techniques with this detailed workshop guide. Learn methods for creating new fields, adding XY data, model building, and executing spatial operations such as clipping, buffering, and intersecting. Master geocoding with ArcMap and Google Fusion Tables, and discover how to create and edit features tailored to specific criteria. From establishing suitable locations for development to documenting workflows, this resource emphasizes practical applications in urban planning and resource management. Perfect for students and professionals alike.

Comprehensive Guide to GIS Advanced Techniques and Tools
E N D
Presentation Transcript
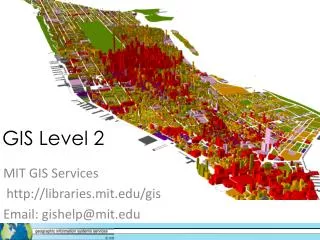
GIS Level 2 MIT GIS Services http://libraries.mit.edu/gis Email: gishelp@mit.edu
- Definition Queries • Create a new field in the attribute table • Field Calculator • Add XY Data and Projections • Modelbuilder • Clip • Buffer • Intersect • - Dissolve • Select by Location • Select by Attributes • - Spatial Join • - Geocodingwith ArcMap • - Create and Edit Features • - Saving and packaging your project • Optional bonus exercises: • - Geocodingwith Google Fusion Tables • - KML in Google Earth and ArcGIS Tools in this workshop
Examples of why to use these types of tools: • Narrow down data based on certain criteria • Pinpoint areas for development • Establish safe zones for habitation • Identify suitable locations for: • natural gas drilling sites • hiking trails • New hospitals and medical facilities • Urban agriculture • Sustainable energy developments • Wastewater treatment plants • … there are many possibilities!
ModelBuilder • Enables users to develop a workflow of their methodology • A process consisting of multiple steps can be collapsed into one tool. • A model can be edited as a python script to run multiple iterations. • A model can be saved and shared on different machines and with other users. • An image of a model is commonly used for documenting a process – in a thesis for example. Example: the model you will create in the exercise for this workshop. The intended result is a layer describing the area in Manhattan that satisfies the following criteria: within 500 feet of a subway station entrance, NOT in School District 3, and zoned residential use.
Definition Query • Define what you want to be (and not to be) displayed on your map • Also applies to any analysis performed afterward Example: UN Member States only
Adding XY Data • A table with columns of X and Y coordinates can be converted into points • You must know the coordinate system beforehand • Example: Towns in Lesotho Africa
Clip • Only features and parts of features within a boundary layer are retained • The input layer can be a point, line, or polygon, but the clip layer must be a polygon Example: European railroad layer clipped for France
Buffer • Creates a polygon surrounding a feature at a given distance • Can be around a point, line, or polygon • Dissolve or create separate features • Examples: 50 miles around mines and 5 miles around rivers in Angola
Intersect • Takes two layers and combines them in a geometric intersection, retaining only space common to both layers • Example: Kansas City urbanized area (one feature) and states (Kansas and Missouri) result in two features for urbanized area in each state
Dissolve • Aggregates features based on specified attributes • Choose a field to create new features • Choose whether multipart features should be created (i.e. non-adjacent features should be combined) Example: Counties dissolved into regions based on a field in the attribute table
Select by Location • Creates a selection in one layer based on some spatial relationship between that layer and another • Example: Storage facilities in Myanmar (Burma) are selected
Spatial Join • Join the table information from two files, based on their spatial relationship. • Relationship options: Intersect, contains, closest, within Example: Associate census tract numbers with business data to explore demographics and potential customers of a neighborhood.
Geocoding • Automatically plot address lists on a map • ArcGIS 10 supports geocoding using an online address locator or create your own. • Google Fusion tables also offer geocoding tools, and is a bonus section of the exercise.
Create and Edit Features • New shapefilescan be created from scratch in ArcCatalog • Features can be edited or created using the editor toolbar Example: creating a major road layer for Havana, Cuba based on an aerial image base map
Map Projections There are many types of map projections. Each projection has certain strengths and also introduces one or more of the following types of distortion: • Shape • Area • Distance • Direction More information on the GIS Services Website in Resources by Topic: http://libraries.mit.edu/gis/teach/resourcesbytopic.html#projections
Map Projections • Define the projection of a data layer • If the software doesn’t understand what the projection is then it will not be able to overlay it in the correct location. A data layer must be defined as what it is according to the metadata. Defined shapefiles will have a .prj file. • Project a data layer into a new projection • This is commonly done to match the projection of other files you are working with or to select an appropriate projection for the location and type of analysis you plan to do. A new file will be created in the projected format. The projection of the data layer must be properly defined before it can be projected. • Choose a projection to display your overall map in by adjusting the properties of your data frame. ArcGIS can do “projection on the fly”, so data layers in your project do not all have be in the same projection.
Today’s Workshop Exercise • Where are the most suitable sites for a new, large apartment complex in Manhattan? • This exercise will take into account the following factors: • Parcel vacancy • Distance to subway station • School district • Zoned land use
MIT GIS Services • GIS lab hours - http://libraries.mit.edu/gis/email : gishelp@mit.edu • Class and general workshop support • Loan GPS units • Access to GIS data: Geodata Repository • MIT GeoWeb & ESRI ArcMap Interface