Bootstrap ?
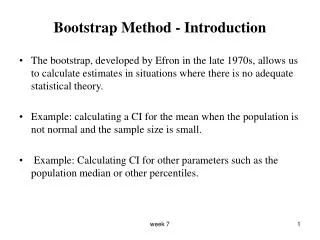
Bootstrap ?. See here. Maximum Likelihood and Model Choice. The maximum Likelihood Ratio Test (LRT) allows to compare two nested models given a dataset.


Bootstrap ?
E N D
Presentation Transcript
Bootstrap ? • See here
Maximum Likelihood and Model Choice The maximum Likelihood Ratio Test (LRT) allows to compare two nested models given a dataset. Twice the difference in ln likelihood (= the ln of the ratio of the likelihood) follows a Chi square distribution with n degrees of freedom, where n is the difference in the parameters between the two models. For the additional parameters to be justified the increase in likelihood needs to be significant. Comparing a phylogeny of i species with and without molecular clock, the degrees of freedom are i-1. To test if a single branch is supported by the data, one could test the resolved tree against the tree with the branch collapsed.
Elliot Sober’s Gremlins Observation: Loud noise in the attic ? Hypothesis: gremlins in the attic playing bowling Likelihood = P(noise|gremlins in the attic) P(gremlins in the attic|noise) ? ?
Likelihood estimates do not take prior information into consideration: e.g., if the result of three coin tosses is 3 times head, then the likelihood estimate for the frequency of having a head is 1 (3 out of 3 events) and the estimate for the frequency of having a head is zero. The probability that both events (A and B) occur Both sides expressed as conditional probability If A is the model and B is the data, thenP(B|A) is the likelihood of model A P(A|B) is the posterior probability of the model given the data. P(A) is the considered the prior probability of the model.P(B) often is treated as a normalizing constant.
P(data|model, I) P(model|data, I) = P(model, I) P(data,I) Likelihood describes how well the model predicts the data Bayes’ Theorem Posterior Probability represents the degree to which we believe a given model accurately describes the situation given the available data and all of our prior information I Prior Probability describes the degree to which we believe the model accurately describes reality based on all of our prior information. Normalizing constant Reverend Thomas Bayes (1702-1761)
Li pi= L1+L2+L3 Ni pi Ntotal Alternative Approaches to Estimate Posterior Probabilities Bayesian Posterior Probability Mapping with MrBayes(Huelsenbeck and Ronquist, 2001) Problem: Strimmer’s formula only considers 3 trees (those that maximize the likelihood for the three topologies) Solution: Exploration of the tree space by sampling trees using a biased random walk (Implemented in MrBayes program) Trees with higher likelihoods will be sampled more often ,where Ni - number of sampled trees of topology i, i=1,2,3 Ntotal – total number of sampled trees (has to be large)
Illustration of a biased random walk Image generated with Paul Lewis's MCRobot Figure generated using MCRobot program (Paul Lewis, 2001)
Why could a gene tree be different from the species tree? • Lack of resolution • Lineage sorting • Gene duplications/gene loss (paralogs/orthologs) • Gene transfer • Systematic artifacts (e.g., compositional bias and long branch attraction)
Trees – what might they mean? Calculating a tree is comparatively easy, figuring out what it might mean is much more difficult. If this is the probable organismal tree: species A species B species C species D what could be the reason for obtaining this gene tree: seq. from A seq. from D seq. from C seq. from B
e.g., 60% bootstrap support for bipartition (AD)(CB) lack of resolution seq. from A seq. from D seq. from C seq. from B
the two longest branches join together e.g., 100% bootstrap support for bipartition (AD)(CB) long branch attraction artifact seq. from A seq. from D seq. from C seq. from B What could you do to investigate if this is a possible explanation? use only slow positions, use an algorithm that corrects for ASRV
Gene Transfer molecular tree: seq. from A seq. from D seq. from C seq. from B speciation genetransfer Gene transfer Organismal tree: species A species B species C species D
molecular tree: seq. from A seq. from D seq. from C seq. from B Lineage Sorting Organismal tree: species A species B species C Genes diverge and coexist in the organismal lineage species D
molecular tree: molecular tree: seq. from A seq. from A seq. from A seq. from B seq. from B seq. from C seq. from C seq. from D seq. from D seq. from D seq.’ from B seq.’ from B seq.’ from C seq.’ from C seq.’ from C gene duplication gene duplication gene duplication seq.’ from D seq.’ from D seq.’ from D Gene duplication Organismal tree: species A species B species C gene duplication species D molecular tree:
Gene duplication and gene transfer are equivalent explanations. The more relatives of C are found that do not have the blue type of gene, the less likely is the duplication loss scenario Ancient duplication followed by gene loss Horizontal or lateral Gene Note that scenario B involves many more individual events than A 1 HGT with orthologous replacement 1 gene duplication followed by 4 independent gene loss events
Function, ortho- and paralogy molecular tree: seq. from A seq.’ from B seq.’fromC seq.’ from D gene duplication seq. from B seq. from C seq. from D The presence of the duplication is a taxonomic character (shared derived character in species B C D). The phylogeny suggests that seq’ and seq have similar function, and that this function was important in the evolution of the clade BCD. seq’ in B and seq’in C and D are orthologs and probably have the same function, whereas seq and seq’ in BCD probably have different function (the difference might be in subfunctionalization of functions that seq had in A. – e.g. organ specific expression)
Y chromosome Adam Mitochondrial Eve Lived approximately 40,000 years ago Lived 166,000-249,000 years ago Thomson, R. et al. (2000) Proc Natl Acad Sci U S A 97, 7360-5 Underhill, P.A. et al. (2000) Nat Genet 26, 358-61 Mendez et al. (2013) American Journal of Human Genetics 92 (3): 454. Cann, R.L. et al. (1987) Nature 325, 31-6 Vigilant, L. et al. (1991) Science 253, 1503-7 Albrecht Dürer, The Fall of Man, 1504 Adam and Eve never met The same is true for ancestral rRNAs, EF, ATPases!
From: http://www.nytimes.com/2012/01/31/science/gains-in-dna-are-speeding-research-into-human-origins.html?_r=1
For more discussion on archaic and early humans see: http://en.wikipedia.org/wiki/Denisova_hominin http://www.nytimes.com/2012/01/31/science/gains-in-dna-are-speeding-research-into-human-origins.html http://www.sciencedirect.com/science/article/pii/S0002929711003958 http://www.abc.net.au/science/articles/2012/08/31/3580500.htm http://www.sciencemag.org/content/334/6052/94.full http://www.sciencemag.org/content/334/6052/94/F2.expansion.html http://haplogroup-a.com/Ancient-Root-AJHG2013.pdf