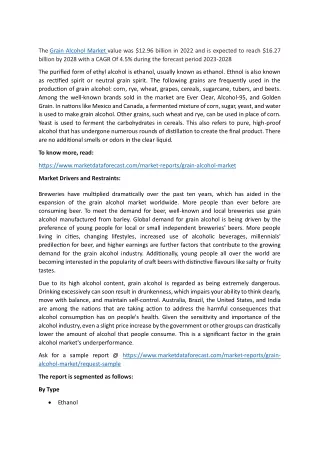
Download
1 / 13
130 likes | 151 Views
This report analyzes the decline in US grain barge services, discussing factors such as higher fuel prices, reliability issues, and waterway disruptions. It also explores the impact of fuel efficiency and unscheduled lock repairs on barge movements. The report concludes that despite a challenging economic climate, lower fuel prices are expected to lead to a recovery in barge shipments in 2009.

E N D
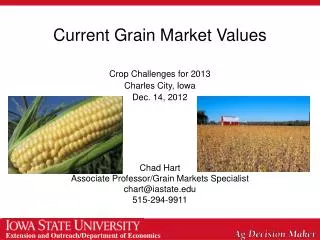
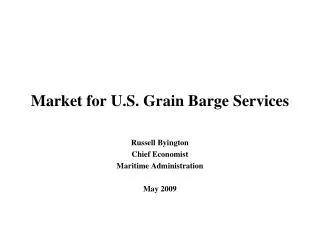
Market for U.S. Grain Barge Services Russell Byington Chief Economist Maritime Administration May 2009
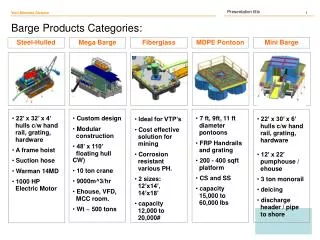
U.S. Grain Exports U.S. is the world’s largest grain exporter. Grains move from the U.S. Midwest to five major port areas: Seattle/Columbia River Ports LA/LB Houston New Orleans Norfolk Seattle, Col. R. Ports Norfolk L.A./L.B Houston New Orleans Rail Barge
Source: Agricultural Marketing Service for rail; USACE for barge.
Why rail increased and barge declined? Higher fuel prices A PNW short-cut to the Far East Higher prices for barge services Higher ocean freights Reliability issues Seattle/Japan 4,498 Mi. New Orleans/Japan 9,405 Mi.
Fuel Efficiency, Water and Overland Modes Fuel Efficiency Measures: Ton-miles/gallon. Mule is the best, but slower and not as reliable as other modes. Runs on oats, a bio-fuel. Customers pay for speed and reliability as well as volume and distance. Fuels Costs/$ of Gross Output. Better for modal comparisons. Rail is best (6.5%) followed by Water (7.5%), truck (12.6%) and pipeline (16.7%).
Waterway Disruptions Reduce Reliability of Barge Services Source: USACE.
Market Model for Inland Grain Barge Shipments BMS = 5.872 + 1.115 Pbarge/Prail – 0.274 Pfuel – 0.046 down (25.529) (2.809) (-6.438) (-2.597) r2 = 0.965 dw = 2.467 int: 1999-2008 BMD = – 0.879 – 2.204 Pbarge/Prail + 1.162 Exports (-0.453) (-5.348) (2.801) r2 = 0.772 dw = 2.138 int: 1999-2008 Pbarge/Prail BM Inland Barge Movements, Grains and Oilseeds, Tons PbargeProducer Price Index, Inland Barge Freight Services PrailProducer Price Index, Rail Freight Services PfuelProducer Price Index, Diesel Fuel Exports Grain Exports, Tons downUnscheduled Lock Repairs, Hrs. S2 S1 D BM
What Ifs2008 Values:BM 60.4 million tonsExports 130 million tonsLock Repairs 70,000 hoursFuel Price Index: 325
Conclusions • Demand for barge services is price elastic (rail alternative). • About one-third of fuel price changes are passed on in higher prices for barge services, compared to 24 percent for rail services. • Unscheduled lock repairs (hours) have increased by nearly 400 percent over the last five years contributing to the decline in barge movements. • Despite a bad economy, lower fuel prices should bring a 2009 recovery in barge shipments. • Never use the “F” (forecast) word. “Persons pretending to forecast the future shall be considered disorderly under subdivision 3, section 901 of the criminal code and liable to a fine of $250 and/or six months in prison” Section 889, New York State Code of Criminal Procedure Cited by Pindyck, R. and Rubinfeld, D, Econometric Models and Economic Forecasts, 1998, p. xiii.
Questions Russell (Buff) Byington russ.byington@dot.gov www.marad.dot/data_statistics