Understanding Box Plots and Quartiles: A Comprehensive Guide
This learning module focuses on understanding box plots and quartiles, essential tools for data handling. Students will learn to calculate the median and quartiles from a set of numbers, interpret box plots, and analyze the distribution of data. Activities will involve real-life data such as test scores and member ages from golf clubs to solidify understanding. The module culminates with practical exercises on comparing quartiles and box plots, providing insight into data spread and consistency.

Understanding Box Plots and Quartiles: A Comprehensive Guide
E N D
Presentation Transcript
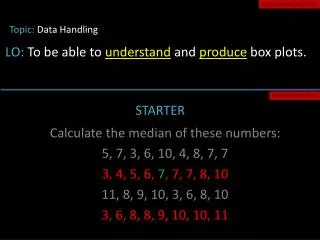
AGREE LEARNING OBJECTIVES Topic: Data Handling LO:To be able to understand and produce box plots. PREPARE FOR LEARNING STARTER Calculate the median of these numbers: 5, 7, 3, 6, 10, 4, 8, 7, 7 3, 4, 5, 6, 7, 7, 7, 8, 10 11, 8, 9, 10, 3, 6, 8, 10 3, 6, 8, 8, 9, 10, 10, 11
Box plots
CONSTRUCT MEANING Quartiles • The quartiles split the data into quarters. • The lower quartile is a ¼ of the way into the data • The upper quartile is ¾ of the way into the data • The median is (i.e. ½) of the way into the data
CONSTRUCT MEANING Quartiles • Here are the maths test results of 23 male students: 3, 3, 3, 3, 4, 4, 4, 5, 6, 6, 7, 7, 8, 8, 8, 8, 8, 9, 9, 9, 9, 10, 10 • Lower Quartile: = = = 6th = 4 • Median: = = = 12th = 7 • Upper Quartile: 3 x LQ = 18th = 9
CONSTRUCT MEANING Quartiles • Below are the ages of 15 members of a golf club. Calculate the median and quartiles for the data. • Lower Quartile: = = = 4th = 24 • Median: = = = 8th= 33 • Upper Quartile: 3 x LQ = 12th= 57 20, 20, 21, 24, 27, 29, 33, 33, 36, 39, 50, 57, 60, 65, 65
CONSTRUCT MEANING Quartiles • Quartiles are more useful when comparing two sets of data. • Here are the ages of another golf club. Calculate the median and quartiles and compare the ages of the members of the two golf clubs • Lower Quartile: = = = 4.5th = 27 • Median: = = = 9th= 47 • Upper Quartile: 3 x LQ = 13.5th= 54 18, 23, 25, 27, 27, 37, 38, 45, 47, 49, 49, 50, 50, 58, 61, 66, 69
DEMONSTATE UNDERSTANDING Quartiles • Which golf club has more younger members? • Which golf club has more older members? • What can you say about the age profile of each golf club in general?
CONSTRUCT MEANING Quartiles • The Interquartile Range(IQR) is the upper quartile – the lower quartile • It tells us how spread out the middle 50% of the data is • Smaller IQR means more consistency and vice-versa
CONSTRUCT MEANING Quartiles “Members of golf club B are more similar in age than in golf club A”
CONSTRUCT MEANING Box Plots • A box plot is a way of illustrating key information about a set of data • They are also very useful for comparing the distribution of two sets of data (e.g. boys vs girls)
CONSTRUCT MEANING Box Plots • To draw a box plot, you need FIVE pieces of information: • The minimum value • The lower quartile • The median • The upper quartile • The maximum value
CONSTRUCT MEANING Box Plots
The Interquartile Range (IQR) is the UQ – LQ. It illustrates the spread of the middle 50% of the data. The larger the IQR, the more spread out, and less consistent the data. • Minimum Value: 3 • Lower Quartile: 4 • Median: 7 • Upper Quartile: 9 • Maximum Value: 10 • Interquartile Range: 5 0 10 8 4 7 2 5 1 3 6 9 Maths Test Scores
The box plot below shows the data for 23 female students. • Girls median higher so on average, girls scored higher • IQR lower so girls results were more consistent • Girls minimum value was higher so boys scored the lowest GIRLS 0 10 8 4 7 2 5 1 3 6 9 BOYS 0 10 8 4 7 2 5 1 3 6 9 Maths Test Scores
DEMONSTATE UNDERSTANDING Box Plots Draw box plots to represent the age of members of the two golf clubs
REVIEW Box Plots • Below are the midday temperatures for Ringwood over the past 11 days (in oC). 20, 22, 16, 17, 16, 18, 20, 18, 16, 21, 18 • Below are the midday temperatures for Glasgow over the past 11 days (in oC). 17, 20, 20, 17, 16, 14, 13, 19, 21, 17, 18 • Draw box plots for the data and write some comments on what they tell you about the temperatures in Ringwood and Glasgow over the past 11 days.