Download
1 / 25
250 likes | 337 Views
Explore how South Florida tackles congestion with express lanes, transit, and technology to cut travel times and improve efficiency.

E N D
Travel Choices and Strategies to Relieve Congestion Presentation to FDOT’s Annual ITS Working Group Meeting March 2008 Debora M. Rivera, P.E.
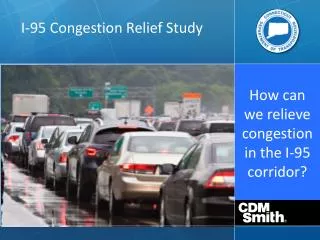
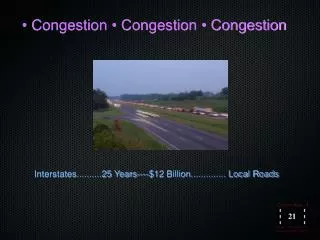
South Florida has the 6th Worse Traffic Congestion in the Nation • Population will Continue to Grow – by 2010 Florida will be the 3rd Most Populous State • ADT on I-95 will Grow to 360,000 by 2030 • Congestion wastes 150 million hours annually costing $2.5B What’s the Problem?
South Florida Population 45% growth between 2000 and 2030 Peak hour operations General use average 13 to 16 mph HOV average 20 to 31 mph 18% of Total Person-throughput on HOV Lane Results from Express Bus Service Demand for Bus Service is High but Travel Times are not Reliable Existing Conditions
1-800-234-RIDE • Travel Demand Management • Reduce, combine or eliminate trips • Peak smoothing • Regulating flow • Increase Occupancy • Carpools, Vanpools • Convenient and Reliable Transit • Incident Management • Rapid Detection and Clearance • Effective Enforcement The Solution
USDOT Urban Partnership Agreement for Express Lanes The South Florida Approach • The 4 T’s Required by the UPA • Tolling (Dynamically Priced ORT) • Transit (Bus Rapid Transit) • Technology (ITS) • Telecommuting • Along With Other Complementary Strategies
What are They and Where Else are They Used? • Physically Separated with Controlled Points of Access • Fixed, Variable or Traffic Responsive Tolls to Manage Demand • Relieve Congestion • Optimize Use of Capacity • Improve Operating Speeds • Provide Incentive for Modal Shift • Offer a Reliable Alternative Express Lanes
21 miles from Miami to Ft. Lauderdale • HOT Conversion of 2 HOV Lanes plus 2 New Express Lanes • Registered 3+ Carpools • Dynamically Priced Tolls • Bus Rapid Transit • Increased Effective Capacity with Minimal Construction Disruption Project Scope
Urban Partnership Agreement • $43.4 Million for Highway • $19.4 Million for Transit • Florida Legislature • $35 Million • FDOT Work Program Elements of Project Funding
HOV-HOT Conversion with Capacity Existing Express Lanes Express Lanes Proposed
Transit Who Can Use Who Can Not
Express Lanes Separated from Regular Lanes with Flexible Posts • 20 spacing • Two Part Assembly for Quick Removal and Replacement • Ingress/Egress Designed to Reduce Conflicts and Improve Flow • Tolls for SOV Users • Traffic Responsive Pricing • Based on Level of Congestion • Optimize Operating Speeds How Will it Work?
Toll Rate Displayed Prior to Entering Express Lanes • Electronic Toll Collection Through SunPass Transponders • “Free” Users will be license tag verified • Heavy FHP Presence will Issue Citations to Violators • SOV without Transponders • Carpools and Vanpools with Less than the Required Occupancy How Will it Work? 5
Vehicle passes under gantry, transponder detected • Toll charged, No electronic toll violation • Vehicle passes under gantry, NO transponder detected • Non-payment light activated • Registered Vehicle, No electronic toll violation • Minimum occupancy Enforced by FHP • Non-Registered Vehicle, Electronic Toll Enforcement Enforcement Scenario
Eliminate County Line Transfer • Expand or Extend Transit Service • Miami-Dade 95 Express Bus Service • Broward US 441 & University Drive with Bus Service into Miami-Dade • Additional Future Routes and Route Extensions • New O&M Costs Offset by Tolls Bus Rapid Transit
Regional • Meet Needs of Commuter Trips • Encourage Shift in Peak and Mode • Complemented by New or Improved Transit Service • I-595, I-75, Turnpike, Palmetto Expressway, Dolphin Expressway Express Lanes Network
Phase 1A • Northbound from SR 112 to Golden Glades Interchange • Between 6/2008 and 9/2008 • Phase 1B • Southbound from Golden Glades Interchange to SR 112 • Between 8/2009 and 11/2009 • Phase 2 • Golden Glades Interchange to I-595 • Between 12/2009 and 03/2010 Implementation Schedule
Phase 1A • Base Bid 250 days • Option for 210 days • Option for 170 days • Phase 1B • Base Bid 650 days • Option for 600 days • Option for 550 days Bid Options Contract Value $121.5 • $104M • Incentive/Disincentive • Total of Up $8M • Phase 1A, up to $3M • Phase 1B, up to $3M • Project Completion $2M
Miami-Dade & Broward County MPOs • Miami-Dade & Broward County Transit • Florida’s Turnpike Enterprise • Miami-Dade Expressway Authority • South Florida Commuter Services Project Support
50% Travel Time Reduction in Express Lanes from Golden Glades Interchange to SR 112 • Transit Transfer Delay Eliminated at Golden Glades Interchange • Offers Benefits Traditional Widening Projects Can Not • Encourages Ride-sharing • Provides Incentives for Transit Use • Implements Demand Management, thus Encouraging Travel During Non-peak Periods • Reduces or Eliminates Trips Project Benefits
511 Service Providing Highway and Transit Information Before You Go • Increased Law Enforcement Presence • More Road Ranger Service Patrols to Rapidly Clear Accidents and Open Lanes to Traffic • Electronic Message Signs to Inform you of Conditions Ahead • Ramp Signaling Complementary Strategies
Red/Green Signals at Selected On-Ramps Regulates the Rate Vehicles Merge onto the Expressway Benefits Include Reduced Congestion and Travel Time Maintain Consistent Traffic Flow Improved Trip Predictability Reduced Rear-end and Side-swipe Accidents Ramp Signaling
10 Northbound, 12 Southbound • NW 62 Street • NW 69 Street (NB) • NW 79 Street • NW 95 Street • NW 103 Street • NW 119 Street (SB) • NW 125 Street • NW 135 Street • Golden Glades Interchange • Miami Gardens Drive • Ives Dairy Road (SB) Ramp Signal Locations
95 ExpressA Multimodal Approach to Congestion Relief • Better Alternative to Traditional Widening • New and Better Travel Choices • Improved Operations Through Travel Demand Management • Reliability and Travel Time Savings