Location Planning and Analysis
Location Planning and Analysis. Prepared by: Bhakti Joshi Presented on: July 18, 2013. Places and Products/Service. In India, KFC and Pizza Hut were first launched in Bangalore and McDonald’s was first launched in New Delhi

Location Planning and Analysis
E N D
Presentation Transcript
Location Planning and Analysis Prepared by: Bhakti Joshi Presented on: July 18, 2013
Places and Products/Service • In India, KFC and Pizza Hut were first launched in Bangalore and McDonald’s was first launched in New Delhi • Jain cakes and Jain pavbhaji were introduced in Mulund in late 1980s • India’s first nuclear weapons test was conducted at Pokhran, Rajasthan • I and many train commuters purchase food packets, sweets, and (sometimes) breakfast from Mumbai’s local trains • Fort area in Mumbai occupies headquartered offices for major banks (Indian & otherwise) • A photocopy shops are in close proximity to courts and banks • Kiraana shops are present mostly around residential homes • Vegetable vendors around my residential surroundings always sell a bundle of spinach along with dill leaves packed together
Influencing Factors • Customer Proximity • Presence of similar businesses • Availability of supporting skills • Role of government • Suppliers of inputs • Climate and effect on environment • Frequency and regularity in utility of product/service
Key Factors for Identifying Location MANUFACTURING SERVICES Availability of Energy & Water Traffic Patterns Proximity to Markets Location of Competitors Proximity to Raw materials Transportation Cost MINIMAL COSTS OF PRODUCTION OR PROVISIONS
Identify What? COUNTRY REGION COMMUNITY SITE • Economic Scenario • Political Stability • Policy / Regulations • Trade relations • Technology • Human Resources • Location to Raw Materials • Location to Markets • Industry or Labour Relations • Climatic conditions • Educational Institutions • Health-care systems • Distribution channels • Transportation • Recreational Activities • Local Policies / Regulations • Environmental conditions • Land • Means of Transportation • Zoning (For example, planning for residential quarters, electricity distribution, water distribution, etc.)
Location Evaluation Approaches Location Cost-Volume-Profit Analysis • Determines volume of production • Focuses on break-even analysis • Considers variable and fixed costs of production Factor Rating • Determines mathematical rating of location factors • Considers qualitative and quantitative factors • Assign weights to each factor Centre of Gravity Method • Determines travel time for shipping or distribution • Involves a map and coordinate system
Cost-Volume-Profit Analysis • Three Elements • Cost: Cost of making the product or providing service • Volume: The number of units of products produced or hours/units of service delivered • Profit: Selling Price of product/service - Cost to make product/provide service = Operating Profit • Fixed and variable costs are available easily • Determine expected output as per the costs • Plot total cost lines for each location • Plot alternative cost lines • Find maximum and minimum costs for expected levels of output Assumptions • Fixed costs are constant • Variable Costs are linear • There is only one product involved • Total Cost = FC + v(Q), where FC=Fixed Cost, v=variable cost per unit, Q (Number of Units)
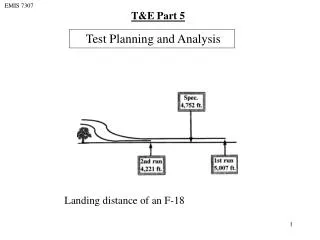
Cost-Volume-Profit Analysis: Example Questions Plot the total costs for these locations on a single graph if the expected output level is 10,000 units per year Identify the range of output for each of the locations If expected output at the selected location were 8,000 units per year, which location would provide the lowest total cost
Example: Question 1 Step 1: Plot only fixed cost on y-axis for each location (at Output = 0) Step 2: For each location plot total cost across x-axis (at 10,000 units of output) 800- 700- 600- 500- Total Annual Costs ($’000s) 400- 300- A D 200- C 100- B Annual Output in 10,000s | 0 | 2 | 4 | 6 | 8 | 10 | 12 | 14 | 16 | 18
Example: Question 2 • Locations which may yield lower costs would be A, B or C • Location D will never yield lower costs • Total Cost = FC + v(Q), where FC=Fixed Cost, v=variable cost per unit, Q (Number of Units) 800- 700- 600- 500- Total Annual Costs ($’000s) 400- 300- A D 200- C 100- B C Superior A Superior B Superior Annual Output in 10,000s | 0 | 2 | 4 | 6 | 8 | 10 | 12 | 14 | 16 | 18 Determine Costs Functions for Locations A, B and C Location A:250,000 + 11 Q Location B: 100,000 + 30 Q Location C: 150,000 + 20Q
Example: Question 2 Contd… Determine Costs Functions for Locations A, B and C Location A:250,000 + 11 Q Location B: 100,000 + 30 Q Location C: 150,000 + 20Q As per the graph, conduct simultaneous equations assuming Q being equal in both cases: Case 1: Locations B and C (B) (C) 100,000 + 30 Q = 150,000 + 20Q 30 Q – 20Q = 150,000-100,000; Q = 5,000 units per year Case 2: Locations C and A (C) (A) 150,000 + 20Q= 250,000 + 11 Q Q = 11,111 units per year
Cost-Volume-Profit Analysis-Example Revenue Cost Total Cost for Alt A Total Cost for Alt B Fixed Cost for Alt B Fixed Cost for Alt A V* Volume of Sales
Factor Rating • Determine relevant and important factors • Assign a weight to each factor with all weights totalling 1.00 • Determine common scale for all factors • Score each alternative • Adjust score using weights (multiply factor weight by score factor); add up scores for each alternative. • The alternative with the highest score is considered the best option. • Minimum scores may be established to set a particular standard, though this is not necessary.
Centre for Gravity Method • Distribution cost is a linear function of the distance and quantity shipped • It consists of a linear map and a coordinate system • Coordinate points being treated as set of numerical values when calculating averages • If the quantities shipped to each location are equal , the centre of gravity is found by taking the averages of the x and ycoordinates • If the quantities shipped to each location are different , a weighted average must be applied
Centre for Gravity Method: Example • Consider three locations A, B and C • Positions of A, B, and C are of coordinates (5,3), (4,2) and (3,6) respectively on a map [(A,B) format, where A is value on x-axis and B is value on y-axis • Possible central location on the map could be [(5+4+3)/3,(3+2+6)/3]…i.e. (4,3.3) making closer to location B • However, A receives 200 customers, B receives 75 and C received 25 customers respectively • Weighted formula as per customers received is considered: i.e. (5*200)+(4*75)+(3*25) which equals 4.58 200 + 75 + 25
sources • http://www.cliffsnotes.com/more-subjects/accounting/accounting-principles-ii/cost-volume-profit-relationships/cost-volume-profit-analysis • http://www.wyzant.com/resources/lessons/accounting/cost-volume-profit • http://classes.bus.oregonstate.edu/spring-07/ba422/Management%20Accounting%20Chapter%207.htm • http://www.wikihow.com/Do-Cost-Volume-Profit-Analysis
Email: bhaktij@gmail.comWebsite: www.headscratchingnotes.net