Download
1 / 1
10 likes | 115 Views
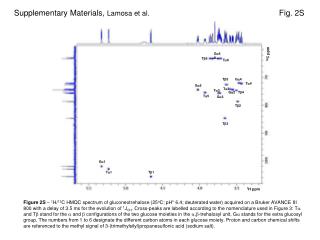
Supplementary Materials, Lamosa et al. Fig. 2S.

E N D
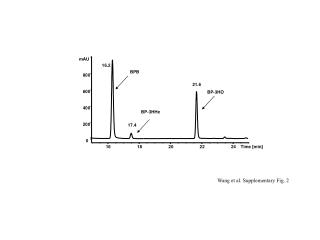
Supplementary Materials, Lamosa et al. Fig. 2S Figure 2S – 1H/13C HMQC spectrum of gluconeotrehalose (25oC; pH* 6.4; deuterated water) acquired on a Bruker AVANCE III 800 with a delay of 3.5 ms for the evolution of 1JCH. Cross-peaks are labelled according to the nomenclature used in Figure 3: T and T stand for the and configurations of the two glucose moieties in the ,-trehalosyl unit. G stands for the extra glucosyl group. The numbers from 1 to 6 designate the different carbon atoms in each glucose moiety. Proton and carbon chemical shifts are referenced to the methyl signal of 3-(trimethylsilyl)propanesulfonic acid (sodium salt).
![[Supplementary materials]](https://cdn1.slideserve.com/2110594/slide1-dt.jpg)