Describing data
Describing data. Dr David Field. General Information. The Research Methods course consists of statistics lectures, workshop exercises, and laboratory practicals Bring calculators to workshops, not mobile phone! You should have two handouts for this lecture containing Handout 1

Describing data
E N D
Presentation Transcript
Describing data Dr David Field
General Information • The Research Methods course consists of statistics lectures, workshop exercises, and laboratory practicals • Bring calculators to workshops, not mobile phone! • You should have two handouts for this lecture containing • Handout 1 • The schedule for Autumn term Psychological Research Methods PY1PR1 • Details of Assessment for this module • Handout 2 • Lecture handout – “Describing data”
General Information • PowerPoint presentations for this lecture series will be available to download from my web page • http://www.personal.rdg.ac.uk/~sxs02dtf/home.html • and also on BlackBoard • There is additional information in the “notes” sections at the bottom of the slides that you won’t see projected on the screen today • So, no need to write everything down • Today’s slides contains some questions that you should try to answer at home using the course textbook • Discovering Statistics using SPSS. 3rd Edition. Andy Field • The questions are repeated in your printed handout at the end
Using the course textbook • The material in today’s lecture is covered in Andy Field chapters 1 and 2 • My slides and handouts will indicate which specific sections of the textbook you need to read • e.g. calculating the mean is covered in section 1.7.2 • But reading whole chapters is a good idea • A guide to the meanings of symbols and Greek letters is given on page XXXI, just before before Chapter 1 • Occasionally I will point out to you an issue where my teaching will diverge from the book • There is subjectivity in statistics • For purposes of this course, my procedure should be followed • If you have studied ‘A’ Level Psychology then you will be familiar with some of today’s topics • But you might find that things are covered in more depth here • If you have not studied ‘A’ level, you might be wondering “Why on earth am I taking a course in statistics?” 1.7.2 1.2
Help with statistics • University of Reading Maths Support Centre • Located on the first floor of the Main Library • Specialist statistics tutor available every Wednesday afternoon in term time from 2.00pm-4.00pm • Alternatively, fill in a form with your question on the website and get a reply by email • http://www.reading.ac.uk/mathssupport/
What is data? 1.5.1.1 • Data is made up of variables • A variable is something that can take different values between individuals or in the same individual at different time points • Gender can take the value “male” or “female” • Age can take a minimum numeric value of zero, and a maximum numeric value of many years • Time to react to your name being called out is an example of a variable that would vary if you measured it in the same individual at several time points • It is usual in Psychology to measure the value of a variable in many separate individuals
What does statistics do to data? • Describe – today’s topic • Different types of variables • categorical, ordinal, continuous (interval and ratio) • If you have measured the same variable in many individuals you need a way of summarising the data • What’s the “average” value? • How much variation is there in the data? • Compare – ask if one group differs from another on the value of a variable • Relate – ask how one variable changes as a function of another one
Variables are classified according to their level of measurement 1.5.1.2 • Country of birth • Example values are France, UK, Germany • this is an unordered category because France is not more or less than the UK • We may assign numbers to category values for convenience (e.g. 1 = UK, 2 = France), but you cannot meaningfully add or subtract the numbers • This severely restricts the type of statistics we can use with categorical variables
Variables are classified according to their level of measurement 1.5.1.2 • Finishing position in a running race • this is an ordinal variable because 1st is better (more) than 2nd • but you can’t finish 1.5th (no decimals)
Variables are classified according to their level of measurement 1.5.1.2 • Finishing position in a running race • this is an ordinal variable because 1st is better (more) than 2nd • but you can’t finish 1.5th (no decimals) • it is not meaningful to say that 3rd is twice as good as 6th because gaps between positions are not equal • therefore, you can’t add, subtract, multiply, or divide the values of ordinal variables and statistics should be calculated based on ranks
Variables are classified according to their level of measurement 1.5.1.2 • Annual salary • this is a continuous variable because the gap between £20,000 and £21,000 is the same as that between £40,000 and £41,000 • it makes sense to add and subtract, and decimal places make sense too • Annual salary has a true zero that refers to the absence of the quantity under consideration (money) • Ratio level measurement • Zero does not mean absence for all continuous variables (e.g. zero celsius is not the absence of temperature) • Interval level measurement
Working with variables • The following examples are based on an imaginary set of data • The following variables have been measured in a sample of 30 people • Country of birth • Intelligence Quotient (IQ) • Extroversion
Measures of central tendency 1.7.2 • If we have values on a variable for a sample of 30 people (or 300 people) one thing we might need to do is summarise the values in a shorter form • The aim is to find a single number that characterises the typical value of the variable in the sample • The options we will consider are the • Mode • Mean • Median • Which one you use depends in part on the level of measurement of the variable
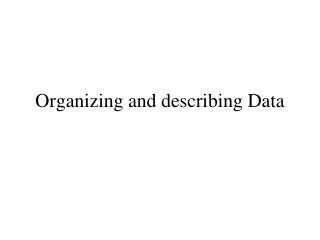
Measures of central tendency 1.7.2 • The mode can be used with all data types, and is the only measure applicable to unordered categories • The mode is the most frequently occurring score, and may be illustrated with a pie chart • In the example data set the variable “birthCountry” contains 15 instances of “France”, 13 instances of “UK”, and 2 instances of “Germany
UK France Germany
Questions to answer at home • What is the modal birth country for a sample containing 20 UK, 23 French, 50 Indian, and 50 Chinese? • What word describes this sample?
Central tendency for ordinal, interval and ratio level variables • Before calculating a measure of central tendency you should first visually inspect the variable using a frequency histogram • Histograms are most informative for large sample sizes of several hundred cases or more • but they are still an essential step for small samples • The first step in producing a histogram is to sort the cases in the variable from lowest to highest • The second step is to count the frequency of occurrence of each value 1.7.1
The 30 IQ values from earlier • 109 90 134 115 114 100 82 140 77 101 103 124 90 72 104 109 79 97 101 105 117 101 96 105 109 97 103 118 68 97 • Sorted: • 68 72 77 79 82 90 90 96 97 97 97 100 101 101 101 103 103 104 105 105 109 109 109 114 115 117 118 124 134 140
Histogram x axis intervals or “bin sizes” • In the previous example the interval was equal to one unit on the IQ scale • Typically, the interval will be wider than a single unit of the scale • Be aware of the interval, because a bad interval choice can make a histogram misleading • often every score contained in a variable is slightly different, so a histogram with very small bin sizes will just look flat
With the same data, the interval is now 5 IQ points Note that the y axis maximum has now changed
With the same data, the interval is now 50 IQ points Note that the y axis maximum has now increased dramatically
The mean (commonly “average”) 1.7.1 • To calculate the mean you sum all the scores (e.g. IQ’s 109 + 90 + 134 + 115 + 114 +….) • Then you divide by the number of scores you added together (30, in the example data set) • This gives an indication of the typical score
The median 1.7.1 • The median is the score that lies in the middle of the sample, which therefore has an equal number of scores higher and lower than it • To calculate the median you first sort the scores, as for making a histogram
The median • Then assign ranking positions in the list and locate the score corresponding to the middle rank • At home, find out how the is procedure modified when the number of scores in the variable is even?
The mean IQ in this sample is 101.9 The median IQ is 102
The mean Extroversion score in this sample is 36.17 The median is 33
When to choose the median • Firstly, if the histogram is not symmetrical about its peak (most frequently occurring value) then the median and mean will differ, and you can make the case that the middle ranking score (median) is a more appropriate description of central tendency • Secondly, if the histogram reveals a few outlying values that seem to be quite different from the rest of the sample, then these outlying values will have a large and disproportionate influence on the mean, but not on the median • Always calculate both and compare them
Measures of dispersion 1.7.3 • Imagine we contact the example sample and use a questionnaire to assess their attitude to the European Union • The questionnaire produces scores ranging from 5 (very negative) to 50 (very positive). • We can compare French and British attitudes to the European Union • There are only 2 Germans in the sample, and intuitively this is too few to assess German attitudes to the European Union
The first 10 cases from the 30 in the example. Note missing data for Germany
Mean 22.20 Median 23 Mean 22.54 Median 23
The range 1.7.3 • The simplest measure of dispersion is obtained by subtracting the minimum score from the maximum score • French sub-sample attitudeEurope has a range of 22 • UK sub-sample attitudeEurope has a range of 31 • Reporting the mean and the range is adequate as a way of comparing UK and French attitudes to Europe in this sample • But the range fails to capture dispersion properly in some cases, which is why the standard deviation is normally preferred • At home, find out what the weaknesses of the range as a measure of dispersion are
The standard deviation 2.4.2 2.4.1 • This is a measure of how much all the scores in a data set vary around the mean in the same units as the mean itself (e.g. years, grams) • A big SD implies very spread out data • If the SD is small the data is clustered close to the mean • Understanding what the standard deviation means, and how to calculate it, is very important • It will be mentioned frequently in the next two lectures
The standard deviation • For each score in the sample, subtract the mean of the sample to produce “deviation scores” • 1 – 6 = -5, 4 – 6 = -2…………………….11 – 5 = 5 • Intuitively, the mean of the deviation scores will be a measure of the amount of variation in the sample But the mean deviation is always zero because the positives deviations exactly cancel the negative ones
The standard deviation • The negative signs are removed by squaring the deviation scores • 22 = 4, -22 = 4, 32 = 9, -32 = 9, -42 = 16 etc • An important statistic called the variance is obtained by assessing the central tendency in the squared deviation scores • Sum the squared deviations • The squaring process increases the relative contribution of scores that are far from the mean to the variance, compared to those scores that are close to the mean • To calculate the variance you divide the sum of squared deviations by the number of original scores minus 1
The standard deviation • The sum of the squared deviations is 64 • The mean deviation (variance) is therefore 64 /(6 – 1) = 12.8 • If the units of the scores is Kg, what is the units of the variance?
The standard deviation • To convert the variance back into units we can understand intuitively we take the square root of the variance and call it the standard deviation • In the worked example the square root of 12.8 is 3.58 • The standard deviation (SD) is in the same units as the sample mean, so, for example, you can write that the mean weight of adult domestic cats in the sample is 5.0 Kg (SD 1.0 Kg) • If the population of cat weights is normally distributed then 68% of cats will weigh 5.0 Kg +/- one SD from the mean • 68% of cats weigh between 4Kg and 6Kg
Mean 22.20 SD 6.5 Mean 22.54 SD 8.7
Variance (s2) 2.4.2 The square (2) of the average difference between each individual score and the mean for that sample Each score in sample Mean of sample Formula: The sum of.. Number of scores in sample minus 1
The standard deviation Formula: Step 1. Calculate the variance Step 2. Take the square root of the variance
Variables are classified according to their level of measurement • Misuse of ordinal variables? • many psychological variables are ordinal, and we routinely break the rules by using statistics that require mathematical operations • We often calculate mean and SD when really we should be using the median • one can try to justify this on the grounds that the intervals between units are ON AVERAGE equal and there are linear relationships between variables in terms of rank order • but if you want to undermine the scientific status of Psychology here is one place to start
Variables are classified according to their level of measurement • Temperature measured in Celsius • this is an interval variable because the gap between 2 degrees and 3 degrees is the same as that between 40 and 41 degrees • it makes sense to add and subtract, and 1.5 makes sense (decimal places) • Does it make sense to multiply and divide? • Is 30 degrees twice as hot as 15 degrees? • What does zero degrees Celsius mean?
Variables are classified according to their level of measurement • Temperature measured in Celsius • "If it's twice as cold today as it was yesterday, and it was zero degrees yesterday, how cold is it today?"
Variables are classified according to their level of measurement • Temperature measured in kelvin • zero kelvin is the point where there is no remaining thermal energy (roughly speaking, molecular activity) • it is not possible to get any colder than 0 kelvin, and having a true zero point makes this a ratio scale • multiplication and division are acceptable • 30 kelvin is twice as much thermal energy as 15 kelvin • weight and age of participants are examples of ratio level variables in Psychology • most Psychological variables are ordinal scales • What limitations does this impose on psychological theory?