Download
1 / 7
70 likes | 154 Views
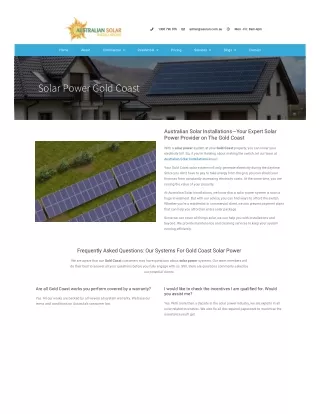
The Power to the Coast Project aims to enhance cost-effective energy services in remote communities using distributed energy resources. Focused on the East Coast, this initiative collaborates with Ngati Porou Hauora to boost local energy efficiency. Su Wei Tan Industrial Research Ltd manages data analysis and wind system installations to optimize energy supply. Research phases include data collection, simulation, and monitoring for sustainable solutions.

E N D
Power to the Coast Project Presented by: Su Wei Tan Industrial Research Ltd
Background • The goal of this programme is to improve the availability of cost effective energy services to isolated communities. • The focus of the research is to create technologies and solutions that make use of available distributed energy resources and integrate with community demand patterns, to improve the efficiency of the local energy supply infrastructure. • This project is centred around the Te Puia Springs community and at other sites on the East Coast. • The local health provider Ngati Porou Hauora is the local partner in this research.
My role in this project • Analysing the existing collected data from Te Puia sites, presenting the results and drawing some useful insights for recommendations in the final programme report. • Taking part in the installation and monitoring of some of the small wind generation systems to be installed over the next few months. • Analyse and report early data from these systems.
Phase 1 – Te Puia Site Data • To obtain continuous 12 month rerords of each monitored house. • Produce a single record representing 1-year demand for an “average” house. • Investigate variances between this and each house and by reference to the interview records, attempt to identify any significant variations in demand profile. • Compare the profiles of the 11 kV supply energy with the average house profile, and report on similarity/variations. • Calculate capacity factors from the collected PV data. Undertake a system simulation using Homer and compare long-term energy generation and capacity factor results. • Compare the demand profiles with the PV and modelled solar generation profiles and comment on the best operating mode to achieve best demand factor from a set of houses if all equipped with a PV system.
Phase 2 – Interim results from the monitored sites outside Te Puia Springs • Help with installation of at least one wind turbine. Using NASA or other publicly available wind data, predict expected wind energy output from this/these sites. Obtain wind site logger data from all sites to date, summarise profiles, calculate capacity factor and determine profile of average output. • Determine level of correlation of wind energy records from the different sites, and with outputs predicted from simulations. • Obtain household surveys and consumption records to date for each house and analyse these. Identify and comment on any variations from the Te Puia set. • Evaluate the cost of supply for the installed wind turbines. • Comment on the impact on the demand factor of the average net wind generation over the period monitored.
What I have done so far • Sorting out the raw data • Group load data in houly interval for each day, from this the average hourly load of each month for each house can be found. • Plot average hourly load of each house on the same graph. • Expecting to finish sorting the data by 2nd week of August.