Download
1 / 22
220 likes | 280 Views
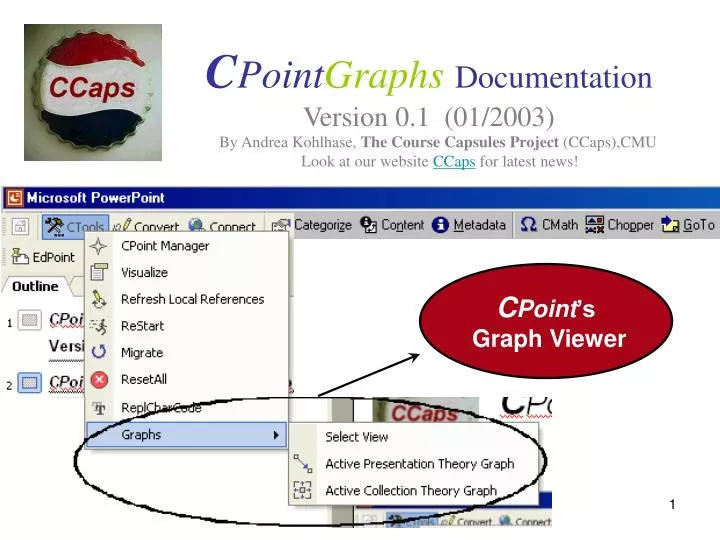
C Point Graphs Documentation Version 0.1 (01/2003). C Point ’s Graph Viewer. By Andrea Kohlhase, The Course Capsules Project (CCaps),CMU Look at our website CCaps for latest news!. Table of Contents for CPointGraphsDoc.ppt. Table of Contents (2). C PointGraphs. CPointGraphs =

E N D
CPointGraphsDocumentationVersion 0.1 (01/2003) CPoint’s Graph Viewer By Andrea Kohlhase, The Course Capsules Project (CCaps),CMU Look at our website CCaps for latest news!
CPointGraphs CPointGraphs = CPoint’s Graph Viewer
CPointGraphsInstallation PremiseCPoint • The PowerPoint-Add-In CPoint.ppa has to be available: • If not already installed by itself, then the file should be located next to CPointGraphs.ppa, so that the installation will be done automatically. Free download of “CPoint.ppa” from http://aiki.ccaps.cs.cmu.edu/ Just follow the download instructions!
CPointGraphsInstallation PremiseGraphViz • The library WinGraphviz.dll has to be installed: Free download of “WinGraphviz.dll” from http://home.so-net.net.tw/oodtsen/wingraphviz/index.htm Just follow the download instructions! To the folks of GraphViz: Big Thanks for an easy to use graph layout tool! Eventually, the option of outputting the dot.txt file is set on. In that case, there needs to exist the folder “C:\Temp” otherwise CPointGraphs starts with a runtime error. I’m very sorry for this inconvenience!
CPointGraphsInstallation The CPointGraphs PowerPoint Add-In can be installed by clicking • Tools • Add-Ins … • Add New … And selecting CPointGraphs.ppa (and OK the forms…) .
CPointGraphs Goal • What is it for? • The process of annotating a PPT presentation is rather difficult. Even more so, as the already marked up information might slip the user’s mind. Here, CPointGraphs comes into it’s own: • View the annotated structure at a glance • View the annotated information in a graph format • Choose from several distinctive views(from a general survey of theories to a detailed theory graph)
CPointGraphs Example The nodes of this graph are the theories in one presentation and their imports-relations as their directed edges (each reading “is imported by”). If they import theories from other collection members, the nodes are outside the colored box.
CPointGraphs Premise • CPointGraphs presents available CPoint annotation data in a graph layout. • Where does CPoint data come from? PPT presentations can get semantically marked up with the aid of the PPT menu bar CPoint. It provides the user with tools to categorize and to structure PPT objects besides adding information.
CPointOverview By The Course Capsules Project (CCaps),CMU Look at CCaps for latest news! Content For marking up objects Convert To other formats Connect To other applications Categorize Objects to add value
CPointGraphsDropdown List Leads to a selection area for distinctive views of annotated CPoint data Creates the theory graph (in which theories are the nodes) for the active presentation Creates the theory graph for all presentations in the active collection
CPointGraphs Select View (I) • CPointGraphs offers several views of CPoint data, ranging • from a general survey of theories for an entire collection • to a detailed graph for a single theory
CPointGraphs Select View (II) The selection in the selection area is based on the following location hierarchy: Theory PPT Presentation Collection • In particular, • the PPT presentation list depends on the choice of a collection in the collection list • the theory list is determined by the selection of a PPT presentation
CPointGraphs Collection • Remember: a collection is a group of PPT presentations (like lectures of a course) defined with the CPoint Manager in the CPoint application. • The collection view presents all theories in an entire collection with their imports-relations. The theories are grouped according to their presentation (discernable by differently colored backgrounds).
CPointGraphs Collection w/o Clusters • The collection without clusters view presents all theories in an entire collection with their imports-relations like the collection view. But the theories are not clustered according to their presentation. The graph is usually much nicer without this restraint. The affiliation to their presentation is given by the background color of each node (all theories of one presentation have the same background color).
CPointGraphs PPT • The PPT view presents a cluster of all theories in one presentation with their imports-relations. If an outside theory is referenced, then the title and presentation information is gathered and shown as independent node outside of the presentation cluster.
CPointGraphs PPT (quick) • The PPT (quick) view presents a cluster of all theories in one presentation with their imports-relations like the PPT view. But the information of an outside theory is not resolved, it is just shown as independent node outside of the presentation cluster.
CPointGraphs Theory • The theory view presents all knowledge components of a given theory (i.e. definitions, symbols, axioms, assertions, proofs, examples, and exercises), their relations, and the theory’s imported theories. The edges of the theory graph are labeled by the kind of relationship the nodes are in. The cluster (with colored background) contains the objects in the sliderange of the given theory.
CPointGraphs Theory Detail • The theory detail view presents all components of a given theory (i.e. the knowledge and the narrative ones), their relations and the theory’s imported theories. The edges of the graph are labeled by the kind of relationship the nodes are in. The cluster (with colored background) contains the objects in the sliderange of the given theory.
CPointGraphs Theory Imports • The theory imports view creates a survey of all iteratively imported theories of a given theory.
CPointGraphs Theory’s Imp. Theories • The theory’s imported theories view presents the theory graphs (i.e. the knowledge components) of all iteratively imported theories of a given theory, and their relations. The edges of the graph are labeled by the kind of relationship the nodes are in. The cluster (with colored background) contains the objects in the sliderange of each theory.