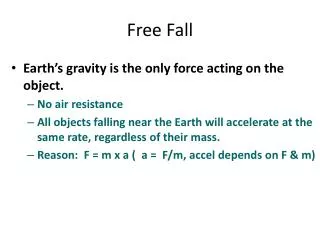
Free Fall Lab - Starter
Free Fall Lab - Starter. What should the position vs. time graph look like for an object dropped from rest?. Free Fall Equations. 1. v f = v i + at. 3. v f 2 = v i 2 + 2 a(y f –y i ). 2. y f = y i + (t/ 2 )(v i +v f ). 4. y f = y i + v i t + ( 1/2) at 2.

Free Fall Lab - Starter
E N D
Presentation Transcript
Free Fall Lab - Starter What should the position vs. time graph look like for an object dropped from rest?
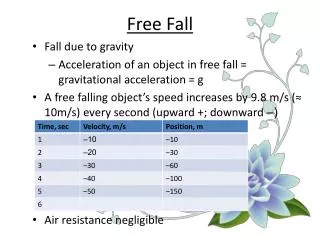
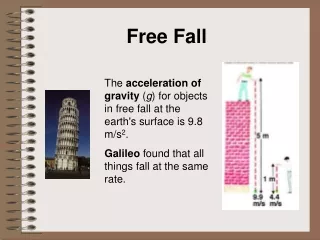
Free Fall Equations 1. vf = vi + at 3. vf2 = vi 2+2a(yf –yi) 2. yf = yi + (t/2)(vi +vf) 4. yf = yi + vit + (1/2)at2 Free Fall a = -9.8 m/s2
Equipment Setup 1st: Obtain a Vernier interface, power cord, USB cord, photogate, picket fence, and a stand with a universal clamp. 2nd: Plug the power cord from the interface into the wall outlet. 3rd: Plug the USB cord from the interface to the USB port on the computer. 4th: Plug the photogate into the interface at DIG 1. 5th: Start LOGGERPRO 6th: Load the experiment: File, Open, Physics with Vernier, 05 Picket Fence Free Fall RETURN ALL EQUIPMENT AS YOU FOUND IT.
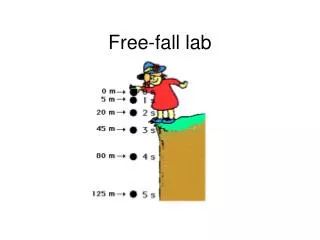
Photogate Setup After it passes through, catch it! Don’t let it hit the ground.
Free Fall Lab Using a photogate and a picket fence, obtain a distance vs. time graph and a velocity vs. time graph for free fall. For the distance vs. time graph, obtain a quadratic fit. From the fit equation, determine a value for the acceleration due to gravity, g. Sketch your graph with the fit equation. C. For the velocity vs. time graph, obtain a linear fit. From the fit equation, determine a value for the acceleration due to gravity, g. Sketch your graph with the fit equation.
Questions Determine the percent error for each of your values for g. Sketch an acceleration vs. time graph for your experiment.
Lab Report Checklist Cover Sheet Two sketched graphs Questions w/ 1 sketched graph Results Section – experimental g and percent error for each graph 5. Summary
EXIT Explain how the photogate and the picket fence work to obtain the distance vs. time graph.