Download
1 / 40
400 likes | 536 Views
Analyzing 5-year trends (2006-2010) in Medicare Part D coverage gap and catastrophic phase for beneficiaries based on plan and demographic characteristics. Data sources include prescription drug event data and Part D plan benefit information.

E N D
Plan and Beneficiary Characteristics Associated with the Coverage Gap and Catastrophic Phase Confidence M. Gbarayor, Ph.D., MPH (ARS Response Card: Channel 41)
Disclosure “I, Confidence Gbarayor, declare no conflicts of interest or financial interests in any product or service mentioned in this presentation, including grants, employment, gifts, stock holdings, or honoraria.”
Learning Objective • “Summarize 5-year trend, 2006-2010, in % of beneficiaries who hit the Part D coverage gap” • Describe beneficiaries who exceed the initial coverage limit (ICL) in terms of plan and demographic characteristics
Overview • Overall, a small percentage of Part D beneficiaries were fully exposed to the coverage gap • Different benefit designs reduced the percent of beneficiaries who experienced the coverage gap and allowed beneficiary’s ability to select the best plan for them • The share of Part D beneficiaries who reached the ICL and/or the catastrophic coverage phase, and the time to reach these thresholds varied by sub-group
Methodology Data Sources • 2006-2010 Standard Analytical File (SAF) of prescription drug event data (PDE) • Limited to Part D covered products • Common Medicare Environment (CME) • Used to identify beneficiary LIS status and other characteristics • 2006-2010 Part D Plan Benefit Information
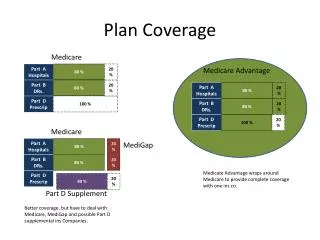
YTD Gross Covered Drug Costs $2,830 $6,440 $310 75% Plan Pays Coverage Gap 80% Reinsurance Deductible 25% Coinsurance $4,550 TrOOP 5% Coinsurance 15% Plan Pays Beneficiary Liability Direct Subsidy/ Beneficiary Premium Medicare Pays Reinsurance Standard Benefit 2010 ICL Pre-ICL CoverageGap Catastrophic $310 $940
Methodology: Overview • Coverage Gap • Plan Specified ICL • Defined Standard ICL • Catastrophic Coverage • Catastrophic Codes
Methodology: Coverage Gap Defined Standard ICL • Set Defined Standard ICL • $2,250 in 2006 • $2,400 in 2007 • $2,510 in 2008 • $2,700 in 2009 • $2,830 in 2010
Methodology: Coverage Gap (continued) Plan Specific ICL • Gross costs accumulated within the benefit year for each beneficiary by date of service • Gross Costs = sum of ingredient cost, dispensing fee, and sales tax • The claim in which the accumulated gross cost exceeded the plan’s ICL was identified
2010 Coverage Gap Overview • Overall, 28.2% (8.4M) of all Part D enrollees reached their ICL in 2010 • When limited to non-LIS, 12.5% (3.7M) of all enrollees reached their ICL • 9.3% (2.7M) of all enrollees were fully exposed to the coverage gap when non-LIS beneficiaries with some type of coverage in the gap were excluded
Decrease from 2007 to 2010 in Percent of Beneficiaries Who Entered Coverage Gap
Larger Share of LIS Beneficiaries in 2010 Coverage Gap 2010 Part D Coverage Gap Entry by LIS Status 28.2%* * Overall Percent of Beneficiaries Reaching Their 2010 Initial Coverage Limit. Total Population= 18.4M Non-LIS Beneficiaries and 11.3M LIS Beneficiaries in Part D for 2010 Year
Beneficiaries Fully Exposed to the Coverage Gap • Non-LIS Beneficiaries with no gap coverage • Excludes beneficiaries in enhanced alternative plans who have additional coverage in the gap for Part D covered drugs • Exposed to 100 percent cost sharing in the coverage gap • Fully responsible for their drug costs
Decrease from 2007 to 2010 in Percent of Non-LIS Beneficiaries Fully Exposed to Coverage Gap * Does not account for other types of coverage provided by other payers, such as State Pharmaceutical Assistance Programs. n = Total Number of Non-LIS Beneficiaries Exposed to Covered Gap in Each Year.
Small Percent of Beneficiaries Fully Exposed to the Coverage Gap * Overall Percent of Beneficiaries Reaching Their Plan’s Initial Coverage Limit. ** Does not account for other types of coverage provided by other payers, such as State Pharmaceutical Assistance Programs.
Methodology: Catastrophic Coverage Analysis • Catastrophic coverage codes on PDE data • Beneficiary has entered the Catastrophic phase • Exceeded Catastrophic Threshold • Pre-defined True Out-of-Pocket (TrOOP) threshold • $3,600 in 2006 • $3,850 in 2007 • $4,050 in 2008 • $4,350 in 2009 • $4,550 in 2010
Decrease from 2008 to 2010 in Percent of Beneficiaries Who Reached the Catastrophic Phase † Overall Percent of Beneficiaries Reaching the Catastrophic Coverage Phase
Coverage Gap and Catastrophic Phase: Subgroups of Beneficiaries
2010 Coverage Gap and Catastrophic Phase Total Part D Population by LIS Status * Overall Percent of Beneficiaries Reaching Their 2010 Initial Coverage Limit. † Overall Percent of Beneficiaries Reaching Their 2010 Catastrophic Coverage Threshold.
2010 Coverage Gap and Catastrophic Phase Total Part D Population by Plan Organization Type * Overall Percent of Beneficiaries Reaching Their 2010 Initial Coverage Limit. † Overall Percent of Beneficiaries Reaching Their 2010 Catastrophic Coverage Threshold. PDP=Prescription Drug Plan; MA-PD=Medicare Advantage Prescription Drug Plan; EMPL=Employer Plan
2010 Coverage Gap and Catastrophic Phase Total Part D Population by Plan Benefit Type • * Overall Percent of Beneficiaries Reaching Their 2010 Initial Coverage Limit. • † Overall Percent of Beneficiaries Reaching Their 2010 Catastrophic Coverage Threshold. • 158K beneficiaries were grouped in plan benefit type unknown, of these beneficiaries 4.6% entered the gap and 1.1% entered catastrophic coverage.
2010 Coverage Gap and Catastrophic Phase Total Part D Population by Gender * Overall Percent of Beneficiaries Reaching Their 2010 Initial Coverage Limit. † Overall Percent of Beneficiaries Reaching Their 2010 Catastrophic Coverage Threshold.
2010 Coverage Gap and Catastrophic Phase Total Part D Population by Race/Ethnicity * Overall Percent of Beneficiaries Reaching Their 2010 Initial Coverage Limit. † Overall Percent of Beneficiaries Reaching Their 2010 Catastrophic Coverage Threshold.
2010 Coverage Gap and Catastrophic Phase Total Part D Population by Age * Overall Percent of Beneficiaries Reaching Their 2010 Initial Coverage Limit. † Overall Percent of Beneficiaries Reaching Their 2010 Catastrophic Coverage Threshold.
2010 Coverage Gap and Catastrophic Phase Total Part D Population by Residential Setting • * Overall Percent of Beneficiaries Reaching Their 2010 Initial Coverage Limit. • † Overall Percent of Beneficiaries Reaching Their 2010 Catastrophic Coverage Threshold. • 19K beneficiaries were grouped in residential setting type unknown, of these beneficiaries 9.0% entered the gap and 2.0% entered catastrophic coverage.
2010 Coverage Gap and Catastrophic Phase Total Part D Population by Geographic Region Coverage Gap Catastrophic Phase * Overall Percent of Beneficiaries Reaching Their 2010 Initial Coverage Limit. † Overall Percent of Beneficiaries Reaching Their 2010 Catastrophic Coverage Threshold.
How Long Do Beneficiaries Spend in Each Phase of the Benefit? • In 2010, 71.8% of Part D enrollees (21.3M) never reached the ICL. • 28.2% of enrollees (8.4M) reached the ICL • Mean time to reach coverage gap = 6.7 months • Mean time spent after reaching coverage gap to end of enrollment or catastrophic coverage = 3.9 months • 8.0% of enrollees (2.4M) reached the catastrophic coverage phase • Mean time spent in catastrophic phase = 4.2 months
Average Time to Reach Gap or Catastrophic Phase has Remained Constant *Average time spent in each phase for Part D beneficiaries that experienced phase for given year.
Time in Part D Benefit Phases Varied by Beneficiary Subgroups (Part I)
Time in Part D Benefit Phases Varied by Beneficiary Subgroups (Part II)
Summary • Trends in percent of beneficiaries that entered Part D coverage gap and catastrophic phase were similar between 2008 and 2010 • Approximately one-third of all beneficiaries in each year from 2006-2010 exceeded their ICL • However, this was meaningful to only about one-tenth of all enrollees in any year (i.e. non-LIS) • Enrollees who were LIS, under 65, female, of minority race (specifically Asian population), or of rural residence exceed the ICL more than other subgroups from 2006-2010 • Time spent in the coverage gap and the catastrophic coverage phase varied little from year to year on average; however differences were seen with beneficiary subgroups and different plan designs
Assessment Question 1 What is the range in the percentage of beneficiaries who enter the coverage gap from 2006-2010? 11% - 15% 28% - 30% 35% - 42% 50% - 59%
Assessment Question 2 Which of the following provides an overall representation of beneficiaries who exceed the ICL? Non-LIS, Under 65 years, female, minority race, or urban residence Non- LIS, Over 65 years, female, minority race, or urban residence LIS, Under 65 years, female, minority race, or rural residence LIS, Over 65 years, female, minority race, or rural residence
Contact Information For more information please contact: Confidence M. Gbarayor, Ph.D., MPH Confidence.Gbarayor@cms.hhs.gov
Presentation EvaluationPlease get your ARS Response Card ready