Download
1 / 35
350 likes | 355 Views
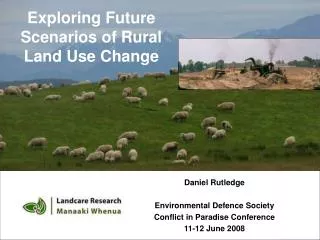
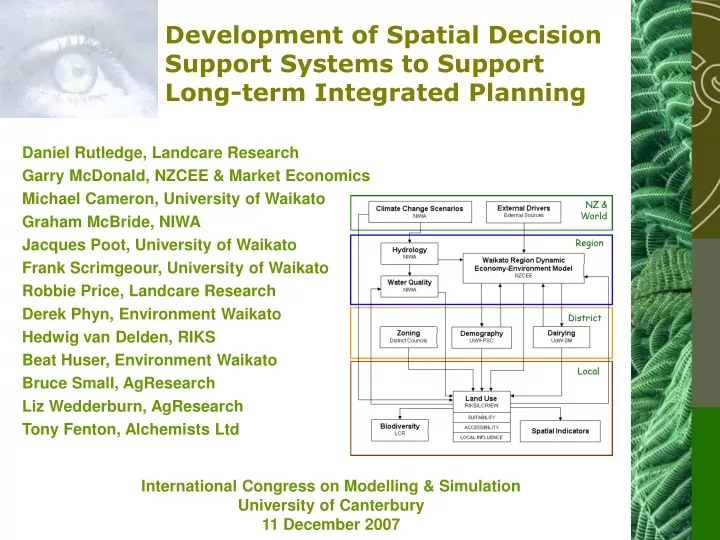
Development of Spatial Decision Support Systems to Support Long-term Integrated Planning. Daniel Rutledge, Landcare Research Garry McDonald, NZCEE & Market Economics Michael Cameron, University of Waikato Graham McBride, NIWA Jacques Poot, University of Waikato

E N D
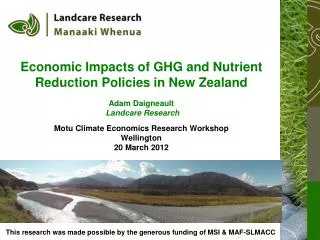
Development of Spatial Decision Support Systems to Support Long-term Integrated Planning Daniel Rutledge, Landcare Research Garry McDonald, NZCEE & Market Economics Michael Cameron, University of Waikato Graham McBride, NIWA Jacques Poot, University of Waikato Frank Scrimgeour, University of Waikato Robbie Price, Landcare Research Derek Phyn, Environment Waikato Hedwig van Delden, RIKS Beat Huser, Environment Waikato Bruce Small, AgResearch Liz Wedderburn, AgResearch Tony Fenton, Alchemists Ltd International Congress on Modelling & SimulationUniversity of Canterbury11 December 2007
What do we want for the future? • Depends on • Whom you ask… • How far ahead we look… • (amongst other things) Despite different individual opinions, values, desires, & utilities, increasingly we express a desire to become sustainable.
New Zealand Policy Context • Resource Management Act 1991“The purpose of this Act is to promote the sustainable management of natural and physical resources.”(Section 3) • Local Government Act 2002“… this Act … provides for local authorities to play a broad role in promoting the social, economic, environmental, and cultural well-being of their communities, taking a sustainable development approach.” (Section 3)Prepare Long-Term Council Community Plans
Environmental Cultural WELL-BEINGS Economic Social
While laudable in principle,how do we become sustainable? How do we plan for it? How do we measure or monitor it? What will it take?
What will it take? “The common theme throughout this strategy for sustainable development is the need to integrate economic and ecological considerations in decision making.”World Commission on Environment and DevelopmentOur Common Future, 1987 “The fundamental task in front of us over the coming decades is to redesign our socio-political-economic system in ways that reintegrate the dependencies between people and our underpinning ecological systems.” Dr. J. Morgan Williams, Former NZ Parliamentary Commissioner for the Environment
Environment Waikato Long-Term Council Community Planning “ Local authorities within the Waikato area have made a commitment to work together to promote the well-being of their communities, consistent with the principles of sustainable development. This commitment is in the form of a signed triennial agreement.” (Page 9) “ Our environmental resources therefore need to be managedsustainably, so that our region’s prosperity and growth can continue for the long-term.” (Page 24)
Choosing Regional Futures Develop and apply planning and communication tools to make informed choices for the future Funded from 2006-2010 by NZ Foundation for Research, Science & Technology
Waikato 2006 • Population: 387,700(Statistics NZ June 06 est.) • Households: 145,100(Statistics NZ June 06 est.) • Land Cover • Agriculture 55.2% • Natural 28.2% • Forestry 14.4% • Urban 1.1% • Other 1.0% • GDP: ~ $12 Billion(2003 GDP + 3% annual growth) • Ecological Footprint: ~9 ha • # Businesses: ~34,000
Waikato 2026? • Population: 426,800(+39,100, Statistics NZ 2026 med. est.) • Households: 169,400(+24,300; Statistics NZ 2036 med. est.) • Land Cover • Agriculture ? • Natural ? • Forestry ? • Urban ? • Other ~ ? • GDP: ~ $33 Billion(2003 GDP + 3% annual growth) • Ecological Footprint: ? • # Businesses: ~50,000+ ? ?
CRF Objectives • Process and communication focus linked to EW Community Outcomes & LTCCP process explore plausible futures (scenarios) develop and trial a Deliberation Matrix 2) Building a spatial decision support system support the planning & communication in Objective 1 integrate economy, environment, society ( & culture?) track indicators across space and/or time explore trade-offs, win-wins, limits
Climate change impacts are bigger than expected • The economy is weaker and slower growing than anticipated • New Zealand has more people than expected • Less money from government ‘GDP’ (profit) Crowded House Sleeping In Natural Capital (resources) ‘mine’ ‘maintain’ Science Society NatureCounts How we measure ‘wealth’ in Waikato • Science and scientists become more important for economic growth • More things are known about what you as an individual are doing; more things are known about what companies are doing • New Zealanders discuss and understand the value of nature in a new way • Economic growth comes from biological and life sciences ‘GPI’ (people)
Objective 1 Deliberation Matrix Strategies / Scenarios Stakeholders Values / Indicators
unstructured problem weakly structuredproblem Uncertainty relative to theknowledge for solving the problem structured problem weakly structuredproblem Conflicting views on values, goals and measures relative to the solution of the problem Why an SDSS? • Long-term integrated planning and resource management are examples of “wicked” or unstructured problems • Characterised by • Multiple actors • Multiple values & views • Multiple outcomes possible • High uncertainty An SDSS helps address unstructured problems • Integrates society, economy, and environment • Identifies links & feedbacks • Sets limits explicitly (e.g., only so much land, water, soil) • Demonstrate importance of “where” in addition to “what” and “how much” • Potential for aggregation/disaggregation
Example: ill-structured problem To be recognised as a District with: • A growing and vibrant community where cultural diversity is celebrated. • A diverse, sustainable economy that provides full employment. • A safe and healthy society, where people can achieve their goals. • A pristine, sustainable environment.South Waikato District Council LTCCP, Page 15
Future Goals (i.e. Community Outcomes) Scenario 1 Scenario 2 Scenario 3 Present (informed by Past) The Process
The CRF SDSS should… • Focus on science and integration, not technology • Address a range of issues in an integrated manner • Be robust and relatively quick • Consider space explicitly • Be adaptable to other regions in NZ.
Time Scientific Technological CRF ProjectConstraints Resources Budget Organisational CRF SDSS Considerations Scope
Scientific Considerations • Interdisciplinary • Systems approach • Spatially-explicit • Multi-scale • 30-50 year temporal horizon
Stocks Flows Goods Labour Wastes Stewardship Services Resources SDSS: Systems Approach Society Economy Environment Systems models track stocks & flows over time
Stewardship Services Spatially-Explicit Goods Society Economy Labour Wastes Environment Resources
Technological Considerations • Multiple data types & sources • Integration of different models with different origins • Portability/adaptability • Speed/ease of use under different settings (i.e. use in community engagement or only “behind the scenes”)
RIKS GEONAMICA Framework • Stand-alone application • Systems models • Multiple spatial & temporal scales • Model components from partners incorporated directly (no passing of data) • History of development and use
Organisational Considerations • Regional & District/City Councils • Primary customer • Want to use SDSS otherwise why bother • Deliver sooner rather than later • Portability • Research • Ability to address a range of issues • Flexibility for simple to complex
Project Structure End User Networks Advisory Group Universite de Versailles Saint-Quentin-en-Yvelines
Waikato Community Outcomes& MARCO Indicators Key Drivers from Qualitative Scenarios Society Economy Environment Community outcomes from 4 other regions SDSS Design by Triangulation
Choosing Futures WaikatoCommunity Themes & Outcomes • Sustainable Environment - The Waikato region values and protects its diverse, interconnected natural environments. • Quality of Life - The Waikato region is a great place to live, providing the services and opportunities we need to live well. • Sustainable Economy - The Waikato region balances a thriving economy with looking after its people, places and environment. • Culture & Identify - The Waikato region identifies with - and values - its land, air rivers and waterways, mountains, flora, fauna and its people. • Participation & Equity - The Waikato region builds strong informed communities and has a culture that encourages people and communities to play their part. Too difficult to interpret – focused on set of 75 core MARCO indicators
Qualitative Scenarios – Key Drivers • World • Climate Change: increased instability, extremes, and spatial variation • Population: migration trends, potential climate refugees • Market changes: number, size, access, consumer preferences, locations • Globalisation: R&D investment • New Zealand • Population: older, increasing proportion of Maori, Pasifika, and Asians; decreasing proportion of Pakehas/Europeans • Lifestyles: changing expectations, influence of technology • Economy: agricultural intensification, new metrics, bio-economy • Energy: availability, affordability, mix of renewable/non-renewable • Housing: affordability, increasingly urban culture • Waikato Region • Land use: intensification; change trends; management and influence on intensity of flooding, erosion, slips; • Auckland: urbanisation pressures • Economy: agricultural intensification • Governance: continued devolution versus greater central authority
4 Comparison Regions • Auckland • ~1/3 of NZ population • Highly urban and urban expansion affects Waikato to the south • Large source of internal tourism for the Waikato • Bay of Plenty • Proximity to Waikato • One major urban centre (Tauranga) • Focused more on horticultural than pastoral • Horizons (Wanganui-Manawatu) • Similar major land uses (agricultural, forestry) • One major urban centre (Palmerston North) • Canterbury • Similar major land uses (agricultural, forestry), increasing dairying • One major urban centre (Christchurch) • Water supply/allocation an issue
NZ & World Climate Change ScenariosNIWA Region District Local Water QualityNIWA HydrologyNIWA Land UseRIKS/LCR/EW External DriversExternal Sources SUITABILITY DemographyUoW-PSC ZoningDistrict Councils ACCESSIBILITY LOCAL INFLUENCE INTEGRATION - LCR LEAD GEONAMICA - RIKS DairyingUoW-SM BiodiversityLCR Waikato Region Dynamic Economy-Environment ModelNZCEE Spatial Indicators Draft SDSS System Design
Land Use Abandoned Bare Ground Broad-Acre Forestry Infrastructure Mine Indigenous Vegetation Pastoral - Dairy Pastoral - Other Other Primary Residential Water Wetland Utilities Services Manufacturing Construction 3 Examples Based on the SDSS Prototype Dairy Expansion Dairy Decline Village Life
What We Want to Achieve • Planning tools that inform communities • Tools expose links and trade-offs • Councils use these tools
Conclusions (so far…) • Successful development requires active and on-going organisational commitment • Tension exists between design flexibility and prioritisation • Spatially-explicit systems model approach should help unite different models & approaches • Technical integration offers adaptive potential & simplifies end-use but generates additional overheads and requires willingness of researchers to relinquish some control.
Thank you! Universite de Versailles Saint-Quentin-en-Yvelines