Download

1 / 18
180 likes | 211 Views
6-1: Seeking Equilibrium: Demand and Supply. The Interaction of Demand and Supply. In a market economy buyers and sellers interact to determine price. This interaction the market moves toward market equilibrium. The Interaction of Demand and Supply (continued).

E N D
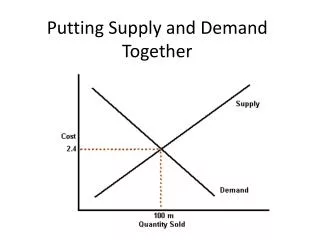
The Interaction of Demand and Supply • In a market economy buyers and sellers interact to determine price. • This interaction the market moves toward market equilibrium.
The Interaction of Demand and Supply (continued) • Equilibrium price: theprice at which the quantity demanded and the quantity supplied are equal
Graph the Market Demand and Supply Schedule • Label the demand curve as D1 and the supply curve as S1. Label the equilibrium point.
Surplus, Shortage, and Equilibrium • Markets do not always function at equilibrium right away
Surplus, Shortage, and Equilibrium • Shortage: the result of quantity demanded being greater than quantity supplied • Surplus: the result of quantity supplied being greater than quantity demanded
Surplus, Shortage, and Equilibrium • Identify equilibrium, surplus, and shortage on a graph
Change in Demand and Equilibrium Price • Review: the 6 factors that cause a change in demand • Income • Consumer taste • Consumer expectations • Market size • Substitutes • Complements
Shifts in the Demand Curve • When a change in consumer taste causes a decrease in demand the curve shifts to the left and there will be a new equilibrium price • The graph looks like this:
Shifts in the Demand Curve (continued) • If a change in demand were to cause an increase in demand, the demand curve would shift to the right and there will be a new equilibrium price • The graph looks like this:
Change in Supply and Equilibrium Price • Review: the 6 factors that cause a change in supply • Input costs • Productivity • Technology • Government action • Producers expectations • Number of producers
Shifts in the Supply Curve • When there is a decrease in supply, the supply curve shifts to the left and equilibrium price rises • When there is an increase in supply, the supply curve shifts to the right and equilibrium price decreases
In Summary… Equilibrium price falls Ifdemand decreases Supply increases Then… OR
If demand increases Equilibrium price rises Supply decreases Then… OR
Questions • 1. Why is the market always moving toward equilibrium?
2. Between 2003 and 2005 there was a huge growth in the market for premium blue jeans priced at $200 or more. Then in the summer of 2005 major department stores cut the price on jeans and these jeans were also sold online. Use the economic concepts from this section to describe what happened in this market.
3. There are 3 pizza parlors in your neighborhood and one of them closes. What will happen to the supply of pizza? How will that affect the equilibrium price of pizza?