Download
1 / 35
350 likes | 401 Views
Learn about domain and range in functions, realistic values, vertical line test, increasing/decreasing functions, maximum/minimum values, even/odd functions, and how to find and interpret the domain and range of a function graphically. Homework included.

E N D
1.3 Graphs of Functions Pre-Calculus
Home on the Range • What kind of "range" are we talking about? • What does it have todo with "domain?" • Are domain and rangereally "good fun for the whole family?"
Definitions • Domain: Is the set of all first coordinates (x-coordinates) from the ordered pairs. • Range: Is the set of all second coordinates (y-coordinates) from the ordered pairs.
Domain • The domain is the set of all possible inputs into the function { 1, 2, 3, … } • The nature of some functions may mean restricting certain values as inputs
Range { 9, 14, -4, 6, … } • The range would be all the possible resulting outputs • The nature of a function may restrict the possible output values
Find the Domain and Range • Given the set of ordered pairs, {(2,3),(-1,0),(2,-5),(0,-3)} Domain Range
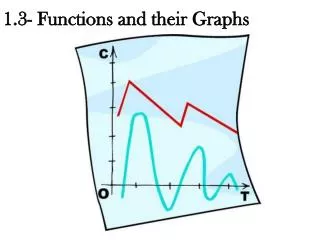
Choosing Realistic Domains and Ranges • Consider a function used to model a real life situation • Let h(t) model the height of a ball as a function of time • What are realistic values for t and for height?
Choosing Realistic Domains and Ranges • By itself, out of context, it is just a parabola that has the real numbers as domain anda limited range
Find the Domain and Range of a Function • Find the domain of f(x) • Find f(-1) • f(2) • Find the range of f(x) *When viewing a graph of a function, realize that solid or open dots on the end of a graph mean that the graph doesn’t extend beyond those points. However, if the circles aren’t shown on the graph it may be assumed to extend to infinity.
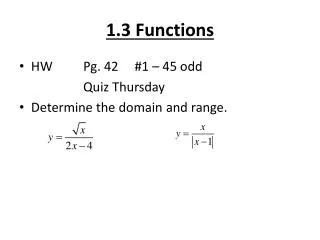
Domain and Range • Find the domain and range of
Vertical Line Test • A set of points in a coordinate plane is the graph of y as a function of x if and only if no vertical line intersects the graph at more than one point.
If a vertical line passes through a graph more than once, the graph is not the graph of a function. Hint: Pass a pencil across the graph held vertically to represent a vertical line. The pencil crosses the graph more than once. This is not a function because there are two y-values for the same x-value.
The Ups and Downs • Think of a function as a roller coaster going from left to right • Uphill • Slope > 0 • Increasingfunction • Downhill • Slope < 0 • Decreasing function 19
Increasing/DecreasingFunctions A function f is increasing on (a, b) if f (x1) <f (x2) whenever x1 < x2. A function f is decreasing on (a, b) if f (x1) >f (x2) whenever x1 < x2. Increasing Decreasing Increasing
Example In the given graph of the function f(x), determine the interval(s) where the function is increasing, decreasing, or constant.
Maximum and Minimum Values Absolute Maximum ( f (c1) f (x) for all x) Local Maximum ( f (c2) f (x) for all x in I • • |c2 |c1 I
Maximum and Minimum Values Absolute Minimum ( f (c1) f(x) for all x) c2| |c1 • I I • Collectively, maximums and minimums are called extreme values. Local Minimum ( f (c2) f(x) for all x in I )
Approximating a Relative Minimum • Use a calculator to approximate the relative minimum of the function given by
Approximating Relative Minima and Maxima • Use a calculator to approximate the relative minimum and relative maximum of the function given by
Temperature • During a 24-hour period, the temperature y (in degrees Fahrenheit) of a certain city can be approximated by the model where x represents the time of day, with x=0 corresponding to 6 am. Approximate the max and min temperatures during this 24-hour period.
Piecewise Defined Functions • Sketch the graph of by hand.
Even functions A function f is an even function if for all values of x in the domain of f. Example: is even because
Odd functions A function f is an odd function if for all values of x in the domain of f. Example: is odd because
Graphs of Even and Odd functions The graph of an even function is symmetric with respect to the x-axis. The graph of an odd function is symmetric with respect to the origin.
Homework • Page 38-41 2-8 even (graphical), 15-18 all, 19-29 odd, 32-36 even, 44, 48, 59-65 odd, 73-81 odd, 91