Self-Organizing Map (SOM) = Kohonen Map
Self-Organizing Map (SOM) = Kohonen Map. artificial neural network topological order 2D lattice of neurons. Self-Organizing Map (SOM) = Kohonen Map. artificial neural network topological order 2D lattice of neurons training with n -dimensional data

Self-Organizing Map (SOM) = Kohonen Map
E N D
Presentation Transcript
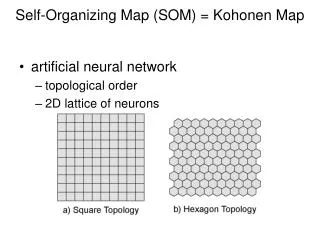
Self-Organizing Map (SOM) = Kohonen Map • artificial neural network • topological order • 2D lattice of neurons
Self-Organizing Map (SOM) = Kohonen Map • artificial neural network • topological order • 2D lattice of neurons • training with n-dimensional data • e.g., census statistics; financial data; text documents
Self-Organizing Map (SOM) = Kohonen Map • artificial neural network • topological order • 2D lattice of neurons • training with n-dimensional data • e.g., census statistics; financial data; text documents
Self-Organizing Map (SOM) = Kohonen Map • SOM as dimensionality reduction method
Self-Organizing Map (SOM) = Kohonen Map • SOM as clustering method
SOM – Examples of Edge Effects • Higher density representation of n-dimensional space at edge neurons • Indicated by: • Higher density of input vectors mapped onto edge neurons • Higher internal variance of input vector mapped onto edge neurons • Criss-crossing of trajectories from one edge to another • what I call the Siberia-Alaska effect in world maps centered on prime meridian (they’re close in geographic space, yet widely separated in world map) • Comparable to the practical difficulty in GIS of showing travel across the date line
Example for higher density at edge neurons (figure from Skupin & Hagelman, 2005) • Census data for TX counties x 3 (1980,1990, 2000) • notice alignment and overplotting along edges
Example for trajectories criss-crossing (figure from Gregg Verutes’ current work) • Movement through knowledge space based on transcribed lectures • Notice long distance moves involving edge neurons (may be real, may be artifact of edges, which is why we need to understand edge effects and whether it helps to counteract them) Graduate Courses Introductory Courses