Understanding Absolute Value Functions: Graphing and Transformations
In this lesson, we explore absolute value functions, focusing on their properties and graphical representations. Absolute value indicates the distance of a number from zero on the number line. We analyze the graph of y = |x|, which takes a "V" shape, and discuss key terms such as vertex and axis of symmetry. We also cover transformations, including vertical and horizontal translations, demonstrating how these shifts affect the graph's position without changing its shape. Through hands-on graphing activities, students will identify patterns in absolute value functions.

Understanding Absolute Value Functions: Graphing and Transformations
E N D
Presentation Transcript
Absolute Value Graphs Mrs. King Unit 9, Day 1
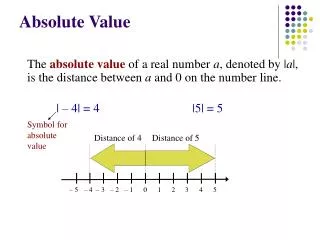
Recall… • Absolute Value: the distance that a number is from zero on the number line
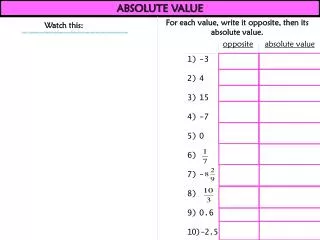
Examples: Find each absolute value. a. |–2.5| b. |7| –2.5 is 2.5 units from 0 on a number line. 7 is 7 units from 0 on a number line. |–2.5| = 2.5 |7| = 7
New Terminology: • An absolute-value function is a function whose rule contains an absolute-value expression.
Vocabulary • The lowest point on the graph of an absolute value function is called the vertex. • An axis of symmetry of the graph of a function is a vertical line that divides the graph into mirror images.
Absolute Value Function • Vertex • Axis of Symmetry
Vocabulary • A transformation changes a graph’s size, shape, position, or orientation. • A translation is a transformation that shifts a graph horizontally and/or vertically, but does not change its size, shape, or orientation.
Try Graphing These Absolute Value Functions Do you notice any patterns?
Try Graphing These Absolute Value Functions Vertical Translation: f(x) + k shifts up f(x) - k shifts down Using your rule, sketch the following problems.
Try Graphing These Absolute Value Functions Do you notice any patterns?
Try Graphing These Absolute Value Functions Horizontal Translation: f(x - h) shifts to the right f(x + h) shifts to the left Using your rule, sketch the following problems.