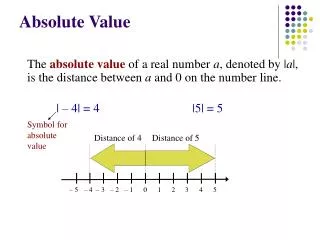
Absolute Value
Absolute Value. Definition. lxl = . If x = 3, then the absolute value of x = 3. If x = -3, then the absolute value of x = -(-3), or x = 3. Parent Function Graph. y = lxl. Vertex – highest of lowest point on the graph of an absolute value function. For this graph the vertex is (0,0).

Absolute Value
E N D
Presentation Transcript
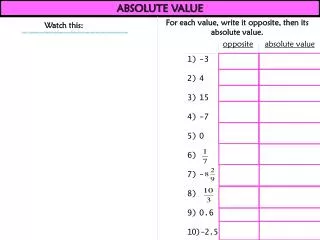
Definition lxl = If x = 3, then the absolute value of x = 3. If x = -3, then the absolute value of x = -(-3), or x = 3.
Parent Function Graph y = lxl Vertex – highest of lowest point on the graph of an absolute value function. For this graph the vertex is (0,0).
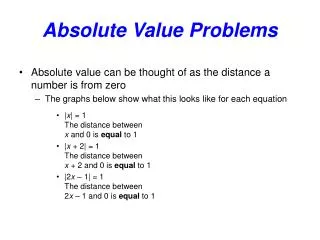
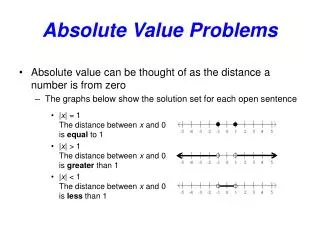
Transformations A transformation changes a graph’s size, shape, position, or orientation. A translation is a transformation that shifts a graph horizontally and/or vertically. It does NOT change its size, shape, or orientation – only the position.
Translation of Absolute Value Graph The graph of y = lx-hl + k is the graph of y = lxl translated h units horizontally and k units vertically. The vertex of is (h,k). y = lx-hl + k Y=lxl (h,k) k (0,0) h
Graph y = lx+5l – 1. Compare withthe graph of y = lxl. Step 1: Identify and plot the vertex. Step 2: Plot another point on the graph. Use symmetry to plot a third point. Step 3: Connect the points with a V-shaped graph. Step 4 : Compare the graphs. Use the word translated in your comparison. How did domain and range change?
Stretches and Shrinks The graph y = alxl is a vertical stretch or shrink of the graph y = lxl when a Choose one and graph it with your table! a = 3, 5, ½ , or ¼
Reflections (FLIPS) When a = -1, then y = alxl is a reflection in the x-axis of y = lxl. When a is negative number besides -1, it is a vertical stretch or shrink with a reflection across the x-axis. Y = lxl Y = -lxl
Multiple Transformations A graph may be related to a parent graph by even more than 2 trans- formations. y = a lx-hl +k can involve a stretch or shrink, a reflection, and a translation of y = lxl.
Example Stop and think about what each part does. y = -3 lx-1l +2 y = a lx-hl +k h,k translates the graph. The new vertex would be (1,2). lal tells you whether you shrink or stretch. Since 3 > 1 then the graph is narrower – vertically stretched. Negative a means you flip so since here we have -3 the graph will be flipped.
Put it into practice Do the following problems with your shoulder partner. Pg. 127: 3-7