Download
1 / 3
30 likes | 116 Views
Explore protein similarity relationships and regulatory motifs in the promoter region of SUS2 using a dendrogram and heatmap visualization.

E N D
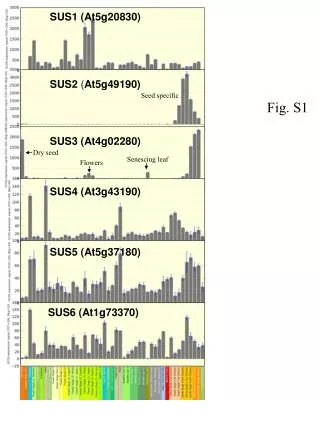
SUS1 (At5g20830) SUS2 (At5g49190) Seed specific Fig. S1 SUS3 (At4g02280) Dry seed Senescing leaf Flowers SUS4 (At3g43190) SUS5 (At5g37180) SUS6 (At1g73370)
A) Dendogram of protein similarity Heatmap bicluster of promotor elements B) Fig. S2
Regulatory motifs in the 421 bp internal promoter region of SUS2 SORLIP2AT GGGCC SURECOREATSULTR11 GAGAC DOFCOREZM AAAG CAATBOX1 CAAT CCAATBOX1 CCAAT SEF3MOTIFFGM AACCCA CCAATBOX1 CCAAT W-box TGACT ARR1AT NGATT ACGTATERD1 ACGT CAATBOX1 CAAT DOFCOREZM AAAG W-box TGACT SURECOREATSULTR11 GAGAC -1049 -1470 -1454 -1283 -1192 -1137 -1360 -1430 -1131 -1259 -1186 -1276 -1176 -1119 -1270 -1169 421bp Fig. S3