Download
1 / 13
130 likes | 599 Views
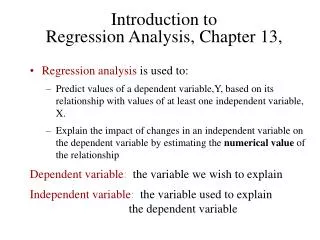
Learn about how regression analysis measures outcomes, predicts variables, and builds models to make probability statements. Understand the importance of independent variables in predicting the dependent variable. Explore examples and methods like least squares regression and straight-line regression models. Get insights from real-life scenarios and practical applications.

E N D
Dependent variable (response variable) • Measures an outcome of a study • Income • GRE scores • Dependent variable = Mean (expected value) + random error • y = E(y) + ε • If y is normally distributed, know the mean and the standard deviation, we can make a probability statement
Probability statement • Let’s say the mean cholesterol level for graduate students= 250 • Standard deviation= 50 units • What does this distribution look like? • “the probability that ____’s cholesterol will fall within 2 standard deviations of the mean is .95”
Independent variables (predictor variables) • explains or causes changes in the response variables (The effect of the IV on the DV) (Predicting the DV based on the IV) • What independent variables might help us predict cholesterol levels?
Examples • The effect of a reading intervention program on student achievement in reading • Predict state revenues • Predict GPA based on SAT • predict reaction time from blood alcohol level
Regression Analysis • Build a model that can be used to predict one variable (y) based on other variables (x1, x2, x3,…xk,) • Model: a prediction equation relating y to x1, x2, x3,…xk, • Predict with a small amount of error
Fitting the Model: Least Squares Method • Model: an equation that describes the relationship between variables • Let’s look at the persistence example
Method of Least Squares Let’s look at the persistence example
Finding the Least Squares Line • Slope: • Intercept: • The line that makes the vertical distances of the data points from the line as small as possible • The SE [Sum of Errors (deviations from the line, residuals)] equals 0 • The SSE (Sum of Squared Errors) is smaller than for any other straight-line model with SE=0.
Regression Line • Has the form y = a + bx • b is the slope, the amount by which y changes when x increases by 1 unit • a is the y-intercept, the value of y when x = 0 (or the point at which the line cuts through the x-axis)
Simplest of the probabilistic models: Straight-Line Regression Model • First order linear model • Equation: y = β0 + β1x + ε • Where y = dependent variable x = independent variable β0 = y-intercept β1 = slope of the line ε=random error component
Let’s look at the relationship between two variables and construct the line of best fit • Minitab example: Beers and BAC