Download
1 / 2
20 likes | 105 Views
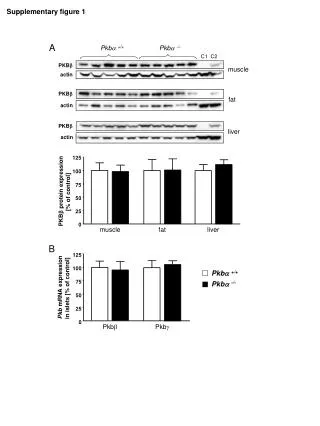
This study analyzes PKB expression in muscle, fat, and liver tissues and its influence on protein and mRNA levels, shedding light on metabolic regulation.

E N D
A Pkba+/+ Pkba-/- C1 C2 PKBb muscle actin PKBb fat actin PKBb liver actin Pkba+/+ 125 Pkba-/- 100 75 PKBb protein expression [% of control] 50 25 B 0 muscle fat liver 125 100 75 Pkb mRNA expression in islets [% of control] 50 25 0 Pkbg Pkbb Supplementary figure 1
150 100 Pkb mRNA expression in islets [% of control] Pkbb+/+ 50 Pkbb-/- 0 Pkba Pkbg Supplementary figure 2


