Download
1 / 17
170 likes | 222 Views
Explore the pathway of depolarization in the heart leading to contraction, understand how ECG measures heart health, and decipher diagnostic insights. Learn about SA and AV Nodes, conduction pathways, and the significance of depolarization in cardiac cells.

E N D
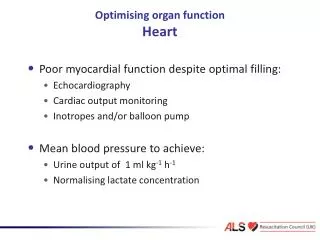
Heart Function: What can the ECG tell us about heart function? 2/3 and 2/6 Goals: What is the pathway taken by he wave of depolarization in the heart that has to come before the wave of contraction? How fast do the regions of the heart conduct a depolarization? How does a tissue depolarization create a voltimeter deflection? What is the sequence of depolarization within the heart? How do heart depolarizations create ECG deflections? What does an ECG really detect and why does it look the way it does? What are the diagnostic parts of an ECG? What does the ECG look like with arrhythmia? What do heart sounds tell us about heart function? • Monday night: Please work on ECG assignment, it is due next Monday!
SA Node-->(Atrial depolarization/contraction)AV NodeBundle of HisLt/Rt Bundle BranchPukinjeMyocardium (Depol./Contract)
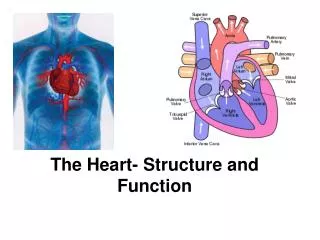
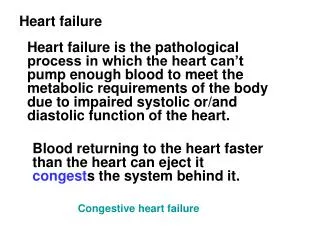
How do depolarizations pass between cardiac cells? • Intercalated discs hold adjacent cardiac cells together and the gap junctions create tiny pores in the discs between the cells allowing passage of ions like Na+ and Ca++, this unites all cardiac cells into an electrical syncitium (all connected). • Conduction Path: SA NodeAtriaAV NodeCommon bundle branchBundle of His R/L Bundle Branches Purkinje fibers Myocardium (contractile cells here). Note: the Conduction rates and Consequence of rates in different locations in the pathway are not the same…this is very important! • Then the wave of depolarization (excitation) spreads from endocardium to epicardium (Inside to Outside) V.I.P. Atrioventricular septum is normally non-conductive to depolarization! Depol only passes through the AV-Node! V.I.P. There is a bit of contraction in the interventricular septum prior to the walls of the ventricles (this is clinically significant!) Heart Rhythm: is the heart conduction coordinated? Nodal vs. Arrhythmia vs. Ectopic Foci vs. Fibrillation
SA Nodal cells are non-contractile and rhythmically depolarize themselves and adjacent cells. Nodal cells eventually depolarize adjacent contractile cells via gap junctions. As a result, the depolarizations of contractile and non-contractile cells are very different! Non-Contractile Cells! Remember: this is depolarization in single cells, not the whole heart!
The heart delays AP passage through the AV node (slow conduction velocity) to ensure that the atria completely contract, loading blood into the ventricles. Then the AP quickly moves through the conduction system to the ends of the Purkinje fibers. Ventricular myocardium to contract the septum then the ventricles from the apex towards the exit point at the semilunar valves located at the base (top) of the heart.
Electrocardiograms (ECGs) lets us measure electrical activity in the heart and measure heart health: 7 Electrocardiogram Rules • ECG is a record of voltage deflections observed in time: • 1) Depol towards a + electrode: + Deflection • 2) Depol away from a + electrode: - Deflection • 3) Depol perpendicular to electrodes: No Deflection • 4) More tissue= Larger depolarization • 5) Body fluids contain salts, salts conduct electricity, so body conducts electrical changes originating from heart • 6) Voltimeter detects electric changes from heart • Voltage changes once/contraction or 70 times/minute • 7) An ECG/EKG/Electroc(K)ardiogram is an expensive voltimeter but easy to use to look at the heart.
EKG/ ECG/ELECTROCARDIOGRAM IS A RECORD OF WHAT HAPPENS WHEN MANY CELLS DEPOLARIZE OVER TIME (Sort of an average action potential for all the cell in the whole heart). • Membrane depolarization creates changing electric field for a cell! • Wave of many cells depolarizing changes electric potential across the whole body on a larger scale! • Voltimeter detects how voltage across heart/body changes! • ECG measures voltage changes over time! Four Rules for Making an ECG: • 1) Wave moving in heart towards + pole+ deflection • 2) Wave moving in heart towards –pole- deflection • 3) More cell mass larger sized depolarization • 4) Perpendicular Wave? Causes of neutral/canceled deflections: • Perpendicular is called “Isoelectric”
What will the ECG deflections look like if strips of myocardium with different sizes/shapes were placed between two electrodes and depolarized in the direction indicated by the arrow? (If the wave of cell-cell Depolarization moves Towards the (+) electrode it creates a Positive Deflection on voltimeter over time) (-) (+) (+) (+) (-) (-) (+) (+) (-) (-) Small Large Small Inverted Isoelectric Isoelectric/Small
What is the normal spread of this wave or depolarization across the heart that normally originates in the SA Node? You need to appreciate this prior to understanding why an ECG looks the way it does! Depolarization starts at SA Node Depolarization ends at basal end of ventricle
ECG: What happens as the entire heart depolarizes relative to a + and -? First: Atrial Depol (P wave) Second: Septal Depol (Q) Third: Depol of Vent Walls (RS waves) Fourth: Repolarize(T-wave) (-) (+)
In this ECG, depolarizing tissue is shown as a dark wave on the heart starting at the right atria. The wave of depolarization moves toward the + electrode in the lower right, creating a positive mV ECG deflection. This is the basic P-QRS-T appearance of an ECG, caused by depolarization of the atria then ventricles, followed by ventricular repolarization (T-wave) (-) (+)
ECGs measure voltage differences between two locations over time. In this case + is left front paw and – is on the back right paw. A wave of depolarization moving towards the positive electrode creates a + deflection and a wave of depolarization moving towards the – electrode creates a negative deflection, and the more mass depolarizing the larger the deflection.
ECG Diagnostics: Look for these on the ECGs of your loved ones who are in the hospital, is the T.V. ECG Real or NOT?.Identification of ECG deflections: Definitions for Test/Clinic: What doe we call the five parts? • P-wave: deflection caused by atrial depolarization • Q-Wave: First NEGATIVE deflection caused by ventricular depolarization • R-Wave: First POSITIVE deflection caused by ventricular depolarization • S-Wave: First NEGATIVE deflection observed AFTER a R-wave • T-Wave: Any deflection that is caused by ventricular REolarization Any of the above may or may not be observed on your ECG depending upon where your positive and negative electrodes were placed on your body. Example: You could have an ECG with just a P and R wave and no observable Q-, S- or T-waves. It is only a matter of how the heart is oriented across the two electrodes of interest.
ECG parts are identified below as intervals and segments (time needed to move between two points on the ECG). Amplitude is always (by convention) measured in millivolts (More tissue depolarizing= ↑ Wave Amplitude) If the RR interval took 1.0 seconds, or it was one second between beats Then (1 beat/second)(60sec/minute)=60 beats/min 1.0 mV Amplitude: millivolts (mV) 0 mV -0.5 mV Time in Units of Milliseconds or Seconds Intervals and segments can tell you about the health of the heart. Example: Is the heart beating too quickly or too slowly? Is the AV node delaying the depolarization too much or is the delay not long enough?
The normal Sinus rhythm is about 70 beats/minuteThe sinus rate can be fast or slow, the ECG lets you measure this.At Rest: Tachycardia: too fast(+100 BPM) Bradycardia: too slow(-60 BPM)
ECGs let you evaluate arrhythmias and abnormal conduction. Heart Block: Depolarization can’t get through the conduction system to the ventricles (Potentially Bad). There are Three Types of AV Block:1st(slow passage), 2nd (occasional passage) and 3rd “degree” (no passage)
Review: WHAT ARE THE PHASES OF THE CARDIAC CYCLERemember: blood only moves if it goes down a pressure gradient. Rest=Quiescence= PASSIVE Ventricular filling- 1)Atrial systole= ACTIVE ventricular filling 2)Ventricular loading from atria ”PRELOAD is the ventricular End Diastolic Volume” 3)Isovolumetric Ventricular Contraction: pressure building so it is greater than that of the aorta/pulmonary artery 4)Ventricular Ejection Terms: SV, Ejection Fraction and ESV • SV=EDV- ESV • Blood pumped into aorta or pulmonary trunk 5)Isovolumetric Ventricular Relaxation- Start over again: Quiescence/ Passive Ventricular filling