Works Cited
River Zone. Saturated Zone. Vegetation. Surface. Unsaturated Zone. Saturated Zone. USING REMOTE SENSING DATA FOR WATER CYCLE AND CARBON FLUX MODELING: MODEL SPIN-UP FOR THE AIRMOSS CAMPAIGN

Works Cited
E N D
Presentation Transcript
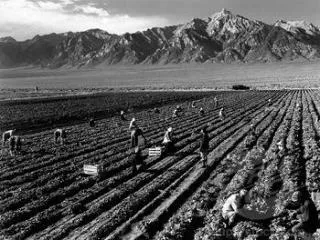
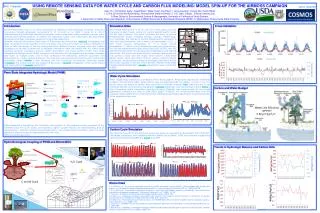
River Zone Saturated Zone Vegetation Surface Unsaturated Zone Saturated Zone USING REMOTE SENSING DATA FOR WATER CYCLE AND CARBON FLUX MODELING: MODEL SPIN-UP FOR THE AIRMOSS CAMPAIGN Xuan Yu1, Christopher Duffy1, Gopal Bhatt1, Wade Crow2, Hui Peng3,4, Lorne Leonard1, Yuning Shi5,Sushil Milak2 1. Civil & Environmental Engineering, Pennsylvania State University, 2. U.S. Dept. of Agric., Remote Sensing Lab., 3. Bren School of Environmental Science &Management, University of California at Santa Barbara, 4. Department of Water Resources Research, China Institute of Water Resources & Hydropower Research (IWHR), 5. Meteorology, Pennsylvania State University AGU Chapman 2012 1260793 Introduction The terrestrial water cycle is one of the most important mediums for the exchanges of energy, water and momentum through biospheric components (J. W. N. Smith et al., 2008, F. Stuart et al., 2011). Understanding the multi-scale interactions between carbon and water cycle is critical to answer many scientific and societal questions. To observe the subsurface carbon and water fluxes, growing remote sensing technologies have been applied for multi-scale observation. Recently, Airborne Microwave Observatory of Subcanopy and Subsurface (AirMOSS) investigation has been developed for high-resolution in time and space root-zone soil moisture and carbon estimation. In order to take advantage of remote sensing data from different sources, coupled water and carbon modeling can provide a framework to integrate information. Here, we started with the offline mode coupling between ecosystem process model: Biome-BGC and hydro system model: Penn State Integrated Hydrologic Model (PIHM) to improve the simulation of hydrological and ecological variables and fluxes at multiple scales and to final understand the interactions between ecosystem and hydrosystem by a fully-coupled approach. The simulation was forced by the North America Land Data Assimilation System (NLDAS) II and validated with the Cosmic-ray Soil Moisture Observing System (COSMOS). The model products are merged at the scale of AirMOSSinvestigation, which will be tested and improved by the AirMOSS observation. Simulation Sites The Harvard Forest (42.54°N, 72.18°W) is one of the oldest and most intensively studied forests, located in central Massachusetts, about 100 km west of Boston. The forest has been the focus of several interdisciplinary studies, including biology, ecology, meteorology, and hydrology. The climate in central Massachusetts represents a cool and moist temperate, with a mean July temperature of 20°C and mean January temperature of −7°C. Mean annual precipitation is 1,100 mm, and is distributed evenly across the seasons. The soils are predominantly sandy loams (sand 65%; silt 29%; clay 6%) derived from glacial till, and are generally moderately to well drained, and acidic. The forests are dominated by transition hardwoods: red oak (Quercusrubra) and red maple (Acer rubrum), black birch (Betulalenta), white pine (Pinusstrobus), eastern hemlock (Tsugacanadensis). All the remote sensing technologiesmentioned before have been applied in Harvard Forest. Besides, Airborne Multi-angle Imaging SpectroRadiometer (AirMISR) experiments were conducted in 2003. Cross Validation Penn State Integrated Hydrologic Model (PIHM) PIHM represents a strategy for the formulation and solution of fully-coupled process equations at the watershed and river basin scales, and includes a tightly coupled GIS tool for data handling, domain decomposition, optimal unstructured grid generation, and model parameterization. PIHM has been applied at different scales of watersheds across the world. http://www.pihm.psu.edu/ Water Cycle Simulation Three neighboring watersheds: East Branch Fever Brook (22km2), Headwaters East Branch Swift River (115km2), and Mill brook Miller’s River (47km2) were simulated by PIHM from 2004-1-1 to 2011-12-31. The model setup was based on spatial data sets: National Elevation Dataset (NED), National Land Cover Database (NLCD), and Soil Survey Geographic (SSURGO) Database, and meteorological data: NLDAS II. The Covariance Matrix Adaptation Evolution Strategy (CMA-ES) was implemented for the model parameters calibration by data in 2004 (USGS gage 01174500). The model performance over the validation period (2005-2011) confirmed that the calibrated parameters reflected the physical properties of the regional water cycle. Carbon and Water Budget Water Use Efficiency NPP/ET 0.92 g C/kg H2O Carbon Cycle Simulation The dominant specie broad deciduous forest and grass are simulated by Biome-BGC from 1992-2011. The model parameters were initialized with the default values (White, 2000) and calibrated against the data from AmeriFlux (LAI, NEE) and MODIS (LAI, GPP). Interception Unsaturated Zone Snow Melt Hydro-Ecological Coupling of PIHM and Biome-BGC Saturated Zone Trends in Hydrologic Balance and Carbon Sink Overland Flow Photosynthesis Maintenance Respiration Channel Meteorological data, Vegetation parameters, Land cover, DEM, Soil, and Geology Mortality Growth Respiration Allocation Coarse Woody Debris Litter Sub-Channel Aquifer Soil Decomposition H2O Cycle C and N Cycle • Works Cited • K. E Mitchell et al., “The multi-institution North American Land Data Assimilation System (NLDAS): Utilizing multiple GCIP products and partners in a continental distributed hydrological modeling system,” Journal of Geophysical Research 109, no. 7 (2004): D07S90. • J. W. N. Smith et al., “Groundwater–surface water interactions, nutrient fluxes and ecological response in river corridors: Translating science into effective environmental management,” Hydrological Processes 22, no. 1 (2008): 151-157. • F. Stuart et al., Principles of terrestrial ecosystem ecology (Springer London, Limited, 2011). • B. D Allen et al., “Proposed investigations from NASA’s Earth Venture-1 (EV-1) airborne science selections,” in Geoscience and Remote Sensing Symposium (IGARSS), 2010 IEEE International (IEEE, 2010), 2575-2578. • M. A White et al., “Parameterization and sensitivity analysis of the BIOME-BGC terrestrial ecosystem model: net primary production controls,” Earth interactions 4, no. 3 (2000): 1-85. • C. Zweck et al., “COSMOS: COsmic-ray Soil Moisture Observing System planned for the United States,” in AGU Fall Meeting Abstracts, vol. 1, 2008, 0909. • F. Maselli et al., “Validating an integrated strategy to model net land carbon exchange against aircraft flux measurements,” Remote Sensing of Environment 114, no. 5 (2010): 1108-1116. Hydrograph, ET, LAI, NEE, NPP, Biomass, fPAR, Soil Moisture, and Groundwater Table Level COSMOS AirMOSS