Download

1 / 24
240 likes | 381 Views
Join industry experts as they discuss the profound impacts of evolving consumer behaviors and technological advancements in retail analytics. With insights from leaders at Safeway, Walgreens, and Yale's Center for Customer Insights, this panel illuminates the strategies needed to adapt to changing shoppers and intensifying competition. Discover how retailers can leverage data to make informed pricing decisions, understand shopper perceptions, and enhance assortment strategies to drive consumer loyalty and sales.

E N D
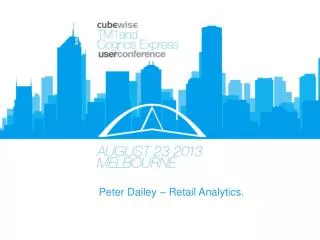
Today’s Panel Jon QuinnVice President, Marketing Strategy, Safeway Adam HolykGroup Vice President, Insights and Analytics, Walgreens Ravi DharGeorge Rogers Clark Professor of Management and Marketing, Yale School of Management & Director, Center for Customer Insights
Complex Dynamics impact Retail Analytics CHANGING SHOPPERS • INTENSIFYING COMPETITION TECHNOLOGY • RETAILER • ECONOMICS
Which items to carry? Simple outcomes, complex analytics • In which stores? • How much Promo Support? • At What Price?
the winning analytic strategy • GET THE RIGHT INSIGHTS • ORGANIZE TO WIN • EXECUTE WITH GREATER PRECISION
The right shopper insights Buyers will not pay for value that they do not perceive, no matter how real it may be. • REQUIRED INSIGHTS: • What they do, inside & outside the box • What they perceive & believe Prof. Michael Porter – Competitive Advantage PERCEPTION OF VALUE DRIVESRESPONSE TO PRICING
Insights to both behavior and beliefs 59% 36% 25% Fresh produce Everyday low prices 1 your share of their All Outlet spend ….they drive most of your dollars Fresh produce Grocery selection of your shoppers are “core”… 2 Well stocked Fresh meat & seafood 3 Prices well labeled Prepared foods 4 Store brand Grocery selection 5 …but they aren’t very loyal One-stop shopping Clean store 6 WHAT SHOPPERS SAID: WHAT SHOPPERS DID: Well stocked Fresh meat & seafood 7 Nearby location 8
The right competitive insights Yoplait 6 ounce Client 3: $0.75 STRATEGY ACTUAL VS. ASSUMED COMPETITORS PRICE POSITIONING
Eyes on the prize, size of the prize OPPORTUNITY $900M 25% • 8MM Elasticity Estimates 10% Also Highly Elastic “Overpriced” 80MM Competitive Price Points
Why Assortment isn’t easy 328 16,897 4,932 • Items selling in Grocery weekly average • Items selling in Drug weekly average Average # of unique UPCs per household purchased in Grocery Channel in a year Can’t profitably be all things to all people Hyper-local assortment impacts supply chain efficiency Assortment is “slower” than pricing, just as important
All demand is local Water Infant Nutrition Frozen Pizza Growing MTA’s: 3,519 Growing MTA’s: 2,414 Growing MTA’s: 659 CHANGE IN DOLLARS DECLINING GROWING STABLE Growing: > 2% $ growth; Stable >-2% and < +2%, Declining > -2% Source: Nielsen Scan and Panel Data, Nielsen Analysis
SIMPLE FRAMEWORKS ENCOURAGE ACTION • RATIONALIZE • Make sure you have the best items in distribution • DEVELOP • Increase Items FAST AVG SALES RATE DISTRIBUTION (# ITEMS) • SQUEEZE • De-list worst performers • NURTURE • Review Slow movers for de-listment SLOW NEGATIVE • CONSUMER RESPONSE TO ASSORTMENT (INCREMENTALITY) • POSITIVE
Locally relevant decisions, at enterprise scale Super- Premium Segment Value Segment Assortment Response:Total Category Assortment Response:Total Category
Right products, right places 4.9% Laundry 4.5% 0.3% Laundry Sales ($MM) Source: Nielsen AssortMan, TUS Mass, 52 weeks ending 10/13/12
Table talk Questions • With the evolution of smart phones and information access, how do you see your analytical needs changing? • As a Manufacturer or a retailer, what would you change about collaboration to address these analytical needs? • What are the industry challenges for analytic strategy and capacity keeping up with the rate of change in the industry, e.g. personalization and dynamic pricing?