Download
1 / 18
340 likes | 4k Views
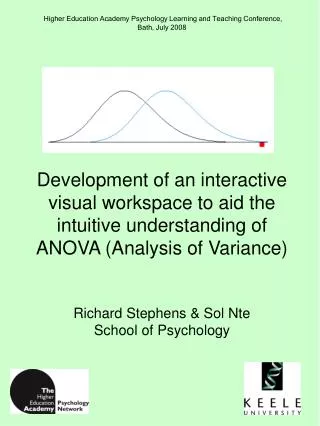
Higher Education Academy Psychology Learning and Teaching Conference, Bath, July 2008 Development of an interactive visual workspace to aid the intuitive understanding of ANOVA (Analysis of Variance) Richard Stephens & Sol Nte School of Psychology. Importance of Statistics in Psychology.

E N D
Higher Education Academy Psychology Learning and Teaching Conference, Bath, July 2008Development of an interactive visual workspace to aid the intuitive understanding of ANOVA (Analysis of Variance)Richard Stephens & Sol NteSchool of Psychology
Importance of Statistics in Psychology • People are the subjects in Psychology research • People vary e.g. cleverness, speediness, attention to detail, etc. • Statistics offer a counter-argument to: “What if all the brainy people were in the experimental group?”
Psych students + statistics = • “Surface learning" (Marton & Saljo, 1984) v.“Deep learning" (e.g. Richardson, 2005) • How to encourage psych students to process statistics at a deep(er) level?
A specific example • ANOVA (Analysis of Variance) • Used where a study includes groups and we want to know whether group means are different • I think you need to grasp 6 concepts to understand ANOVA properly (to integrate info and process it more deeply)… • Histograms/ distributions • Variance • The F ratio • “Significance” • Type I error • Underlying assumptions • Q: How can these be taught in a more integrated fashion?
Our idea • A software applet and tutorial package presenting a medium rendering ANOVA and its assumptions visually and dynamically • Aimed to demonstrate key concepts, so facilitating in students a more intuitive grasp of ANOVA and its assumptions • Mills (2002; Journal of Statistics Education) recommends computer simulation methods for teaching statistics (but notes absence of empirical evaluation studies) • Existing web-based ANOVA demonstration applets (see links on final slide) criticised: • lack an intuitive interface • omit assumptions of ANOVA • not evaluated • We tried to rectify these problems and we included an empirical evaluation study
Literature review • We could find no formal evaluations of comparable software applets • But there are reports of positive student evaluations of other demonstrative teaching methods applied to ANOVA... • Software that graphically presented ANOVA designs (Rasmussen, 1996); • A demonstration of ANOVA sources of variance using cardboard boxes of different weights (Sciutto, 2000) • A classroom exercise demonstrating the effects of violations of ANOVA assumptions (Refinetti, 1996) • Conclusion: there is pedagogic merit in developing and empirically evaluating a novel software applet for teaching ANOVA and its assumptions
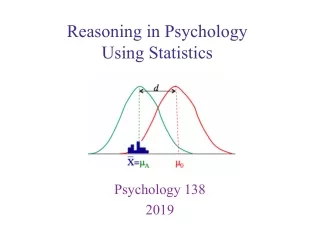
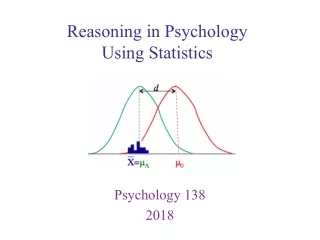
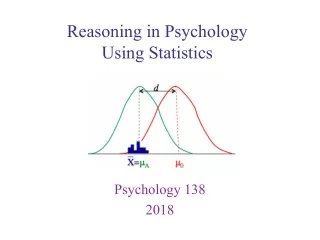
Two normal distributions • Right is moveable, morphable and can be viewed as a curve or histogram • The distributions are generated algorithmically in real-time (i.e. NOT animations) • Generated using the highly skewable log-normal distribution, given by the formula • Controls vary the location (), shape () and scale (m), adjusting the core properties of the blue distribution • Added an algorithm allowing adjustment of N to explore sample size and power
ANOVA Demo • Learning outcomes: • How ANOVA works: F = between grps / within grps variance • Homogeneity of variance assumption • Normality assumption & kurtosis • Normality assumption & skewness • Relationship between sample size and statistical power • Disk • www
Evaluation • A classroom comparison study in Y1 Psyc research methods module • Aimed to assess, empirically, the dynamic interactive aspect, so • 59 experimental group participants used the software online (moveable) • 52 control participants studied paper copies (static) • 10-item MCQ class test applied twice: immediately and after a 1 hour delay • An 8-item qualitative feedback questionnaire inbetween
Evaluation Results • P’pants answered 6.54 items on the class test correctly (standard deviation 2.3), but.. • No effect of group, F(1,106) < 1, no effect of delay, F(1,106) = 1.238, p = 0.268, and no group x delay interaction, F(1,106) < 1 • The control group responded slightly more favourably on the qualitative items (chi-sq p>0.05) • 89 subsequent Blackboard (VLE)visits, average visit time 2.5 minutes – the longest average visit time of all course items • We did see improvements on the module examination…
Conclusion • Likely to be an improvement (exam perf), but could not pinpoint the interactive aspect as necessary • Over-stringent control condition??? • Useful class exercise + in lectures • Significant amount of assumed knowledge, e.g. the normal distribution and its depiction in a histogram???
Math(s) anxiety • “A general fear of contact with mathematics, including classes, homework and tests” (Hembree, 1990) • Predicted maths performance in a mixed sample of adults (Miller & Bichsel, 2004) • In the late 80s classroom interventions (e.g. using microcomputers) were not effective at reducing maths anxiety (Hembree, 1990) • But…
3 principles • Appearance should be the antithesis of anxiety; cuteness (Marcus, 2002) • NOT abstract; metaphor of data drifting down from the real world to the statistics world • Incorporated a game mode to address the need to achieve “deep learning”by allowing students to “learn by doing”
Demonstration of the normal distribution/ histograms • Learning outcomes – to explain: • What the normal distribution is; • How it is depicted with a histogram; • How to produce a histogram; • Properties of the normal distribution that make it useful in statistics (e.g. 68% of values fall within 1 standard deviation of the mean; the mean is at the centre, etc.) Disk www
Using computer graphics to illustrate key concepts underlying basic statistics • People seem to think it’s a good idea even if there’s not much empirical support • Attractive to funders • Don’t be too stringent in your choice of control when doing a first evaluation • Can be creative – good to be so • Need a good programmer!
References • Dancey, C.P. & Reidy, J. (2002). Statistics without maths for psychology. 2nd Edition. Harlow: Prentice Hall. • Hembree, R. (1990). The nature, effects, and relief of mathematics anxiety. Journal For Research In Mathematics Education, 21, 33-46. • Marcus, A. (2002). The cult of cute: the challenge of user experience. Interactions 9(6), 29 - 34. • Marton, F. & Saljo, R. (1984). Approaches to Learning. In Marton, F., Hounsell, D. and Entwistle, N.J. (eds), The Experience of Learning: Implications for Teaching and Studying in Higher Education, 2nd ed, Edinburgh: Scottish Academic Press. • Miller, H. & Bichsel, J. (2004). Anxiety, working memory, gender, and math performance. Personality and Individual Differences, 37, 591-606. • Mills, J.D. (2002). Using computer simulation methods to teach statistics: A review of the literature. Journal of Statistics Education [Online], 10(1).(http://www.amstat.org/publications/jse/v10n1/mills.html) • Rasmussen, J.L. (1996). ANOVA MultiMedia: A program for teaching ANOVA designs. Teaching of Psychology, 23, 55-56. • Refinetti, R. (1996). Demonstrating the consequences of violations of assumptions in between-subjects analysis of variance. Teaching of Psychology, 23, 51-54. • Richardson, J.T.E. (2005). Students’ approaches to learning and teachers’ approaches to teaching in higher education. Educational Psychology, 25, 673-680. • Sciutto, M.J. (2000).Demonstration of factors affecting the F ratio. Teaching of Psychology, 27, 52-53. Link to our ANOVA demo • http://www.psychology.heacademy.ac.uk/miniprojects/anova/anova1.html Link to our Normal Distribution demo • http://www.keele.ac.uk/depts/ps/RSStat/index.html Links to other online statistics demos • http://www.ruf.rice.edu/~lane/stat_sim/one_way/index.html • http://www.psych.utah.edu/stat/introstats/anovaflash.html • http://www.csustan.edu/ppa/llg/stat_demos.htm