Download
1 / 10
100 likes | 188 Views
Energy supply forecast. Presentation to Connecticut’s Energy Future Conference by Bridgett Neely, London Economics International LLC December 2, 2004 Hartford, CT. London Economics has extensive experience in the New England power sector. Examples of New England experience

E N D
Energy supply forecast Presentation to Connecticut’s Energy Future Conference by Bridgett Neely, London Economics International LLC December 2, 2004 Hartford, CT
London Economics has extensive experience in the New England power sector Examples of New England experience • Economic support for acquisition of large NE portfolio, including FERC 203 filings • Long term price forecasts for NE market, including cost-based simulation modeling and game theoretic analysis • Valuation and regulatory analysis of LNG facilities • Assessment of ISO NE market design for securitization of certain hydro-electric assets • Assessment of default supply obligations • Support to CT DPUC for TSO auction • Electricity supply, demand, and price forecasting for regions across the US and abroad • Cost benefit analysis to quantify net economic and social benefits from various infrastructure projects (including generation and transmission) • Due diligence support for asset acquisitions and divestitures • Energy procurement and auction design specialists • Support in FERC filings, especially regarding market power issues • Expert testimony
Connecticut is part of the ISO New England control area; represents 27% of region’s demand
Connecticut faces growing electricity demand – 1.2% p.a. through 2010 Factors that could change demand forecasts • actual population growth • immigration • increase or decrease in industrial activity • increase or decrease in economic growth • extreme weather (affects peak demand, and load shape) • demand response programs
12,000 Import 10,000 Demand Response Other Capacity MW Nuclear Capacity MW 8,000 Hydro Capacity MW Petroleum Capacity MW Gas Capacity MW 6,000 MW Coal Capacity MW 4,000 2,000 0 2004 2001 2003 2005 2007 2008 2009 2010 2000 2002 2006 While on a statewide basis, CT has sufficient supply to meet expected peak demand through 2010… CT Supply-Demand Forecast Existing power plants and transmission infrastructure in CT Peak demand
6,000 5,000 RFP for SWCT Emergency Capability SWCT Reliability Project - Phase 2 4,000 SWCT Reliability Project Phase I Additions 3,000 MW Current Import Limit Total Net Capacity 2,000 1,000 0 2004 2005 2006 2007 2008 2009 2010 …CT has isolated pockets of heavy load where local generation is insufficient to meet demand and transmission highly constrained S-D Forecastfor Southwest CT Issues in SW CT: • SWCT transmission system does not meet NEPOOL reliability standards • SWCT is short of capacity to meet summer peak load forecast plus operating reserve until the proposed Southwest Connecticut Reliability Project is in service Other potential problems • Possible retirement of older, less efficient units • Thermal overload and low voltage conditions • Short circuit limitations Peak demand
Average Monthly Day Ahead CT LMP Prices $90 $80 $70 $60 $50 Day ahead LMP Prices in CT $/MWh November 2003 - October 2004 $40 Average $53.64 $30 Min $0 Max $578.56 $20 $10 $0 Jul-04 Jun-04 Jan-04 Oct-04 Apr-04 Mar-04 Nov-03 May-04 Aug-04 Feb-04 Dec-03 Sep-04 Monthly Average Day Ahead LMP New Entry Trigger Price Additional infrastructure is needed to address CT’s load pockets Potential power plant projects: • Ridgebury Power (10 MW – 2005) • South Norwalk (50 MW 2005) • Towantic Energy Center (508 MW – 2007) • New Britain (520 MW – 2007) • Kleen Energy project (520 MW – 2008) CT has a strict renewable portfolio standard that must also be taken into consideration
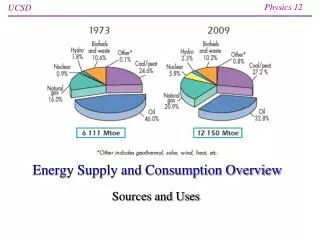
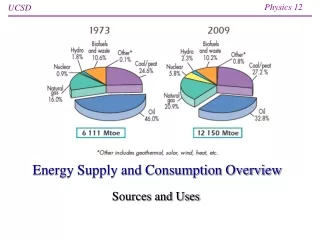
Increasing oil prices and dependence on foreign oil imports impact CT’s energy supply issues
Gas is a critical prerequisite for additional supply Gas already supplies almost 25% of US energy needs – and most new power generation capacity Gas production in US and Canada declining Environmental and NIMBY concerns inhibiting opening new land to drilling and development Alaska and other frontier areas would require massive investment – gas not likely to be available until 2010 LNG could help but sufficient infrastructure will not be in place for at least 4-5 years Natural gas forwards at Henry Hub ($/MMBtu) Consensus on sustained high gas prices in near term Potential for even higher prices if colder or hotter than normal
2005 CT supply curve 2010 CT supply curve $200 $200 Peak Demand: 6,716 MW Peak Demand w/Exports: 7,536 MW $180 Peak Demand: 7,129 MW $180 Peak Demand w/Exports: 7,949 MW $160 $160 Avg Demand: 3,904 MW $140 $140 Avg Demand w/Exports: 4,724 MW Avg Demand: 4,144 MW $120 $120 Avg Demand w/Exports: 4,964 MW Marginal Cost ($/MWh) Marginal Cost ($/MWh) $100 $100 $80 $80 $60 $60 $40 $40 $20 $20 $- $- - 2,000 4,000 6,000 8,000 10,000 - 2,000 4,000 6,000 8,000 10,000 However, even with new (gas-fired) resources, average annual wholesale electricity prices are likely to stay in $60/MWh range given current gas price trends Note: X-axis presents cumulative DNC, i.e. unadjusted for transmission constraints and availability