Download
1 / 13
240 likes | 867 Views
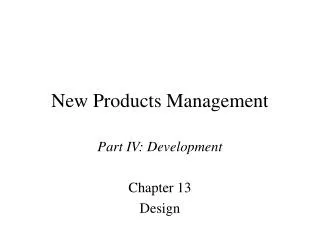
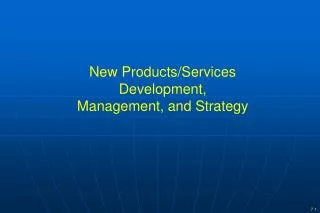
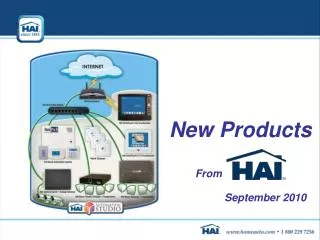
New Products Management. Part III: Concept/Project Evaluation Chapter 8 The Concept Evaluation System. Figure 8-1. The Evaluation System. Evaluation Techniques Opportunity identification; market descriptions PIC; judgmental responses; preliminary analyses; concept testing

E N D
New Products Management Part III: Concept/Project Evaluation Chapter 8 The Concept Evaluation System
Figure 8-1 The Evaluation System Evaluation Techniques Opportunity identification; market descriptions PIC; judgmental responses; preliminary analyses; concept testing Checklists, profile sheets, scoring models Protocol checks, prototype tests, concept tests, product use tests STMs, controlled sale, test marketing, rollout, economic summary, etc. Phase I. Opportunity/ Strategic Planning II. Concept Generation III. Concept/ Project Evaluation IV. Development V. Launch
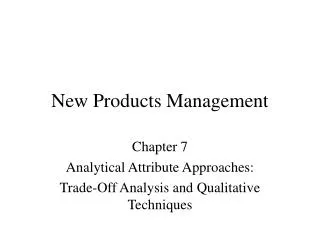
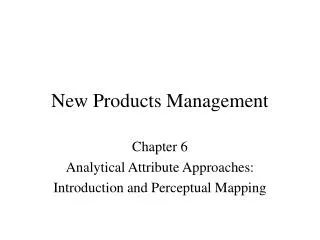
Figure 8-2 Cumulative Expenditures Curve % of expenditures Many high-tech products Many consumer products Time Launch
Planning the Evaluation System: Four Concepts • Rolling Evaluation (tentative nature of NPD process) • Potholes • People • Surrogates
Rolling Evaluation (or, "Everything is Tentative") • Project is assessed continuously (rather than a single Go/No Go decision) • Financial analysis also needs to be built up continuously • Not enough data early on for complex financial analyses • Run risk of killing off too many good ideas early • Marketing begins early in the process • Key: NPD participants avoid "good/bad" mindsets, avoid premature closure
Potholes Know what the really damaging problems are for your firm and focus on them when evaluating concepts. Example: Campbell Soup focuses on: • 1. Manufacturing Cost • 2. Taste
People • Proposal may be hard to stop once there is buy-in on the concept. • Need tough demanding hurdles, especially late in NPD process. • Personal risk associated with NPD. • Need system that protects developers and offers reassurance (if warranted).
Surrogates • Surrogate questions give clues to the real answer. Real Question Surrogate Question Will they prefer it? Did they keep the prototype product we gave them after the concept test? Will cost be competitive? Does it match our manufacturing skills? Will competition leap in? What did they do last time? Will it sell? Did it do well in field testing?
The A-T-A-R Model: Definitions • Buying Unit: Purchase point (person or department/buying center). • Aware: Has heard about the new product with some characteristic that differentiates it. • Available: If the buyer wants to try the product, the effort to find it will be successful (expressed as a percentage). • Trial: Usually means a purchase or consumption of the product. • Repeat: The product is bought at least once more, or (for durables) recommended to others.
Figure 8-5 An A-T-A-R Model of Innovation Diffusion Profits = Units Sold x Profit Per Unit Units Sold = Number of buying units x % aware of product x % who would try product if they can get it x % to whom product is available x % of triers who become repeat purchasers x Number of units repeaters buy in a year Profit Per Unit = Revenue per unit - cost per unit
A-T-A-R Model Application 3 million Number of owners of sports cars x 40% Percent awareness after one year x 20% Percent of "aware" owners who will try product x 40% Percent availability at auto parts stores x 50% Percent of triers who will buy for second car x 1.5 Number of devices the typical trier buys per year x $12.50 Price per unit minus trade margins and discounts ($25) minus unit cost at the intended volume ($12.50) =$1,800,000 Profits
Points to Note About A-T-A-R Model 1. Each factor is subject to estimation. Estimates improve with each step in the development phase. 2. Inadequate profit forecast can be improved by changing factors. If $1,800,000 profit forecast is inadequate, look at each factor and see which can be improved, and at what cost.
Figure 8-7 Getting the Estimates for A-T-A-R Model Market Concept Product Component Market Item Research Test Use Test Testing Test Market Units xx x x x Awareness x x x x Trial xx x x Availability x xx Repeat xx x Consumption x x x xx Price/Unit x x x x xx Cost/Unit x xx xx: Best source for that item. x: Some knowledge gained.