STREAM FLOW AND RAINFALL RUNOFF
690 likes | 1.04k Views
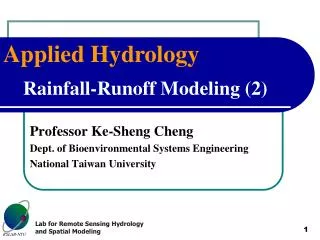
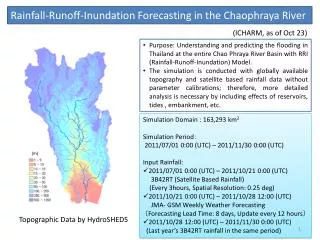
STREAM FLOW AND RAINFALL RUNOFF. INTRODUCTION. Rainfall has an effect on stream flow and hydraulics tends to measure the relationship between rainfall and stream flow. The aim of measuring stream flow is mainly in establishing a stage discharge relationship. STAGE-DISCHARGE RELATIONSHIP.

STREAM FLOW AND RAINFALL RUNOFF
E N D
Presentation Transcript
INTRODUCTION • Rainfall has an effect on stream flow and hydraulics tends to measure the relationship between rainfall and stream flow. • The aim of measuring stream flow is mainly in establishing a stage discharge relationship.
STAGE-DISCHARGE RELATIONSHIP • 5.2 STAGE MEASUREMENTS • Stage measurements are mainly made with gauges. • 5.2.1 Manual Gauges • a) Sectioned Staff Gauges: A series of posts each overlapping. • The height above a certain datum is measured. • The stage is usually related to height above mean sea level(msl)
Stage Measurements Contd. • A certain datum level is on the bridge and a string having a weight electrically connected is lowered to the water surface to get the depth of water surface. • Stage measurement can be inaccurate if there is scouring.
Rules Guiding Location of Gauges • a) Gauges should not be located in rivers with scouring characteristics. • b) The locations should stir clear of river bends because the water surface is inclined and there is turbulence making the stage measurement inconsistent. • c) The upstream of a natural control eg. a rapid should be used, not downstream. Calm area Rapid
Rules Guiding Location of Gauges Contd. d) A uniform channel helps good stage measurement. Irregular cross sections should be avoided. O.K. Avoid this irregular section
Recording Gauges • They have advantages over the manual ones. • a) Float Gauge: Float movement fluctuates with change in stage and this is recorded by a chart. In hydrologic measurements, both the big and low flows are measured within the chart.
Float Gauge Chart Float
b) Digital Recorders • They have clocks and used when for example hourly measurements are desired usually where stages do not increase and decrease steeply. • The recorder should be placed at a height more than the expected peak stage. • To know the maximum stage expected, an ordinary gauge can be used for some time.
c) Crest Gauges • They only measure peak flows. • It is a cylindrical tube sealed below with only a few holes to allow the water to enter the tube. • A ground cork fixed in the tube floats up and is held by surface tension when stage increases. • It stays at maximum stage until the reading is taken and let loose.
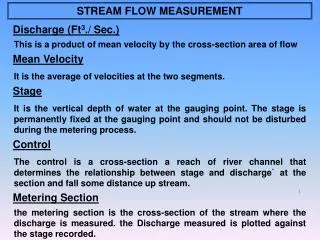
DISCHARGE MEASUREMENTS Current Meter: It has a propeller which is rotated when water hits it and is connected to magnets which actuates recorders when the propeller rotates. The velocity of water increases the propeller rotation.
Current Meter Contd. The number of rotations are measured and correlated to velocity using the formula: • V = a + bN where N is the rotation of the propeller (revs per sec) • a and b are coefficients determined by calibration in an experimental flume.
Current Meter Contd. Surface Velocity Velocity b 0.6 D 1 D Average Vel a Propeller Rotation, N
Current Meter Measurements Contd. • Considering the velocity profile with depth, average value of velocity can be obtained at 0.6 of the depth. i.e. V = average velocity is at about 0.6 D. • An alternative of using the 0.6 D velocity is to take 0.2 and 0.8 velocities and obtain the averages. • The latter method is more accurate but in a shallow cross-section, the velocity at 0.2 D may be difficult to measure so use a single value at 0.6 D.
Determination of Discharges V 0.2D D V0.8D Average Discharge = V x area of Segment
Measurement of Discharges Contd. • First divide the cross-section of the stream into vertical sections such that no section carries more than 10 % of the total flow. • Take soundings to determine various depths. The sections are of a known width and so the discharge can be calculated if the velocities are taken along the 0.2 D and 0.8 D OR 0.6 D alone.
Discharge Measurements Contd. • Flow in one segment, q = Average velocity(V) x Area of segment. • Area of each segment can be calculated using the trapezoidal formula. • Total discharge, Q is equal to: (average velocity x area of segments)
Discharge Measurements Using Floats • Any floatable substance eg. a tennis ball is placed at a point and the time(t) it takes it to move a known distance is noted. • d/t gives the average surface velocity of the water. • The surface velocity(Vs) is equal to 1.2(average Velocity, V) ie. Vs = 1.2V and V = 0.8 Vs. • The cross-sectional area of flow is then multiplied by the average velocity to get the flow rate.
STAGE-DISCHARGE RELATIONS • Simultaneous measurements of stage and discharge provide a calibration graph known as stage-discharge relations or rating curve. • Stage: Height of stream level measured from an arbitrary datum. • Depth: Measured from the bottom of the channel. • The datum can also be the mean sea level. A plot of stage Vs discharge is made to obtain a rating curve.
Rating Curve Contd. • The essence of the rating curve is that when the curve is established for a particular stream, subsequent determinations of discharges are merely obtained by dipping a measuring stick to measure the stage. • Discharge is then read from the rating curve. • The rating curve should be checked from time to time for accurate measurements.
Rating Curve Concluded Stage depth Rating Curve stage Datum Discharge
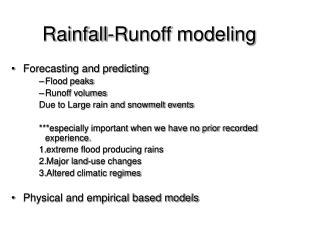
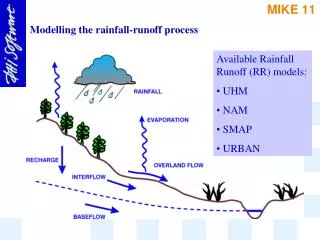
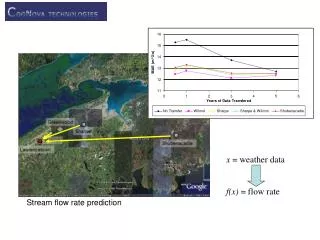
RAINFALL RUNOFF • INTRODUCTION: Runoff results from rainfall occurrence in a hydrologic catchment. Rainfall-runoff relations are very important in hydrology. • Most work on the prediction of runoff requires past records. • The problem is that some streams are not gauged. • Also, non-recording gauges only gives the volume of water and not intensities.
Rainfall Runoff Contd. • There is the need to get records of stream flow and recording gauge information to predict runoff from rainfall. • Some empirical methods are available for predicting runoff in a catchment without the stream flow and recording gauge information.
RUNOFF PREDICTION • Aims • a) To estimate the peak runoff flows(qp) • b) To estimate runoff volume. qp Volume of runoff Time
Definition of Time of Concentration • This is the longest time it takes for a part of the catchment to contribute water to the outlet. • It is the time it takes for all the parts of the watershed to be contributing water to the outlet. • The divide or watershed divides the flow of water along different slopes. • All runoffs flow from the whole catchment to the stream or outlet.
Catchment The Other One Catchment Catchment Area
Time of Concentration Contd. • After rainfall, the time for water to move from different areas of the catchment to the outlet differs according to the different positions of places. • Time of concentration (Tc) refers to when all the catchment areas are contributing runoff to the outlet. • It is the time taken for the most remote area of the catchment to contribute water to the outlet.
Time of Concentration Contd. • Another name for Tc is gathering time. Tc can be related to catchment area, slope etc. using the Kirpich equation: • Tc = 0.02 L 0.77 S – 0.385 • Tc is the time of concentration (min); • L is the maximum length of flow (m); • S is the watershed gradient (m/m).
Time of Concentration Contd. Et L Eo S = (Et - Eo)/L where Et is the elevation at top of the watershed and Eo is the elevation at the outlet. Tc can also be obtained from Table 3.1 of Hudson's Field Engineering.
Time of Concentration Contd. • With Tc obtained for the catchment, decide on a return period. • For small conservation works, return period is assumed as 10 years. • With the Tc and assumed return period, get an intensity value from the Intensity-Duration curve derived for the area described in Chapter 4 of this course.
Time of Concentration Contd. • From figure below, the highest runoff of a catchment is obtained when rainfall duration is equal to Tc. • T will give lower intensity of rainfall so lower runoff while T' will give higher intensity but not all parts of the watershed are contributing to runoff since Tc has not been reached. • The worst case of runoff is then when rainfall duration (D) is equal to Tc.
Rainfall Intensity Duration Curve Rainfall Intensity 2 5 10 Return periods T’ Tc T Rainfall Duration (D)
Runoff Prediction Methods • There are different methods for predicting peak flows of runoff and total volumes of runoff. • A. Methods of Estimating of Peak Flows • Many methods have been developed for estimating the probable maximum floods to be expected from small agricultural catchments. The major ones include:
a) The Rational Formula: • It states that: • qp = (CIA)/360 • where qp is the peak flow(m3 /s); • C is dimensionless runoff coefficient; I is the intensity of a storm of duration Tc (mm/hr) for a given return period. This is the worst case of runoff (see last section). • A is the area of catchment(ha).
Using the Rational Method • i) Obtain area of catchment by surveying or from maps or aerial photographs. • ii) Estimate intensity using the curve in Hudson's Field Engineering, page 42. • iii) The runoff coefficient C is a measure of the rain which becomes runoff. On a corrugated iron roof, almost all the rain would runoff so C = 1, while in a well drained soil, nine-tenths of the rain may soak in and so C = 0.10. The table (see handout) from Hudson's Field Engineering can be used to obtain C value. Where the catchment has several different kinds of characteristics, the different values should be combined in proportion to the area of each.
b) Cook's Method: • Three factors are considered: • Vegetation, • Soil permeability and • Slope. • These are the catchment characteristics. • For each catchment, these are assessed and compared with Table 3.4 of Hudson's Field Engineering
Example • A catchment may be heavy grass (10) on shallow soils with impeded drainage(30) and moderate slope(10). • Catchment characteristics (CC) is then the sum of the three ie. 50. • The area of the catchment is then measured, and using the Area, A and the CC, the maximum runoff can be read from Table 3.5 (Field Engineering, pp. 45).
Cook’s Method Contd. • This gives the runoff for a 10 yr return period. For other return periods, other than 10 years, the conversion factor is: • Return Period (yrs): 2 5 10 25 50 • Conversion factor: 0.90 0.95 1.00 1.25 1.50 • Another factor to be considered is the shape of the catchment. • Table 3.5 gives the runoff for a catchment, which is roughly square or round. For other catchment shapes, the following conversion factors should be used: • Square or round catchment (1) Long & narrow (0.8) Broad & short (1.25)
Components of the Hydrologic Cycle Rainfall Overland Flow Interflow Channel Ppt. Groundwater
Components of Runoff Contd. • Hydrographs originate from rainfall. Some rainfall infiltrate, others run off (overland flow). • Some rain fall direct to the channel (channel precipitation). • The overland flow varies according to the roughness of soil and slope. • There is then a time lag for it to reach the outlet. • Water can also move below the soil but re-surface and join the channel (interflow).
Components of Runoff Contd. • Some go direct to the groundwater and then to the channel (outlet). A hydrograph therefore has 4 components: • a) Overland flow b) Interflow • c) groundwater or base flow and • d) channel precipitation. • All these different routes contribute to runoff. The pathway runoffs take influences the shape of the hydrograph.
Techniques for Separation of Components of Hydrographs • There is the need to separate different forms of flows especially separating base flow from direct runoff. • This is because direct runoff results from a definite rainfall event of known intensity and can be related to runoff directly. • Hydrographs consist of direct surface runoff (overland flow, channel precipitation and interflow) and base flow (groundwater). Some techniques exist for separation of the two components.