Download

1 / 41
410 likes | 499 Views
Delve into the complexities of air quality science and legal frameworks, exploring historical impacts, health implications, and global perspectives. Learn about key regulations such as the Clean Air Act and the ongoing challenges in assessing and mitigating air pollution risks. Uncover the intersection of environmental science and law in addressing the fundamental problem of air quality uncertainties, with a focus on California's efforts and societal impacts. Navigate through the evolution of air quality policies, enforcement, and public health considerations, shedding light on the intricate dynamics shaping our ambient environment.

E N D
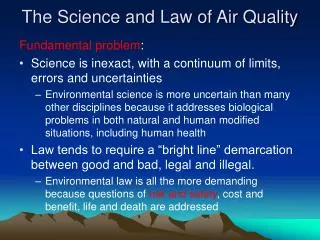
The Science and Law of Air Quality Fundamental problem: • Science is inexact, with a continuum of limits, errors and uncertainties • Environmental science is more uncertain than many other disciplines because it addresses biological problems in both natural and human modified situations, including human health • Law tends to require a “bright line” demarcation between good and bad, legal and illegal. • Environmental law is all the more demanding because questions of risk and safety, cost and benefit, life and death are addressed
The Science and Law of Air Quality • Air Quality • Science of air quality • gasses • Particles • Risk and Safety • Historical impacts of air pollution • European and eastern US concerns • California problems - Example: Lead and CA freeways • Clean Air Act – 6 (7) criteria pollutant CO (HC), SO2, NO2,,ozone,lead, and TSP mass • Amendments and key modified regulations • 1977 (visibility in Class 1 areas), Example: Grand Canyon • 1987 TSP to PM10 • 1991 (regional haze and eastern sulfur reduction), • 1997 PM10 to PM2.5 (fine particles) Example: vf/uf, diesel, WTC
Global Perspective • Despite using 1/5 of the world’s energy and about 1/3 of the worlds VMT, the US has much better air quality than most of the developed or developing countries • Air quality in major international cities outside of Western Europe is usually appalling! • California leads the nation in cleaning up smog • In 1965, Los Angeles was worse than Mexico City in 1995 • The Central Valley lags but still is not bad by global standards • There is no way that Fresno is really the 4th most polluted urbanized area in the US (Sacramento is listed the 7th) since most forms of “pollution” are not considered in the ranking. • Blue skies and good visibility in the Sacramento Valley each Fall (rice stubble burning suppressed); Bakersfield (oil improvement)
Health Impacts of Air Pollution • 1890 – onward - Industrial Impacts – “black lung”, “brown lung”, silicosis, toxics, ….. • 1930s - Meuse Valley (FR) and Donamora, PA – 100s of excess deaths • Essentially ignored – The Great Depression • London “killer” smog of 1952 • First serious studies; doubled death rate • Los Angeles becomes a national joke – • stinging eyes, brown haze
Health Impacts of Air Pollution • 1970s – onward – Major work of health effects of ozone in California • Health and welfare, including crops and forests • 1980s – major EPA epidemiological studies – Harvard “6 cities study” over 10 years; Utah valley, others • Soon becomes the “Gold Standard”; • introduction of PM2.5 “fine particle” standard 1997 • 1990s – major international efforts at long term “epi” studies aided greatly by the decline in cigarette smoking • 1990s - some gaseous pollutants de-emphasized • 2000 – better animal models, etc, isolate the heart as the target of fine particles • Very fine/ultra fine particles arise as causal factors
Welfare Impacts of Air Pollution • 1970s – onward – Major work in California • Bimodal particle size distribution and visibility reduction • Effects of gaseous pollutants (ozone, PAN) on vegetation • 1977 – National visibility studies (viz CAA 1977) • Airport visibility nationwide • First aerosol measurements Class 1 areas • 1980s – start of national effort at aerosols and visibility (NPS, 1981; IMPROVE 1987) • First actions under CAA 1977 “plume blight” – control of haze at Grand Canyon NP • 1991 Kuwaiti oil fires rekindle global climate /aerosol connection • Major international studies ongoing • Aerosols now 80% of the uncertainty in global climate forcing models
Calculation of Risk NRC Redbook 1983 • Hazard identification • Qualitative evaluation of adverse effects • Exposure assessment • “Maximally exposed individual” MEI versus • Population at large • Dose response • Animal models, scaled • Linear extrapolation to zero • Risk characterization • Reduction of lifespan • Tumors, leukemia cases per 100,000 people in specific regions
Problems with Risk Assessment • Maximally exposed individual is not realistic for the person with maximum exposure • Repeated use of conservative assumptions (The EPA “Precautionary Principle”) propagates error • No assessment of the fate of the pollutant under transport • Failure to validate and test assumptions • Entire process often happens within the EPA – science, evaluation, assessment, and standard setting, with major political conflicts of interest
Factors in Safety Judgments • Risk assumed voluntarily Risk assumed x 1000! involuntarily • Effect immediate Effect delayed • No alternatives available Many alternatives available • Risk known with certainty Risk not known • Exposure is essential Exposure is a luxury • Encountered occupationally Encountered non- occupationally • Common hazard Dread hazard • Affects average people Affects especially sensitive people • Will be used as intended Likely to be mis- used • Consequences reversible Consequences irreversible
Protection by Criteria and Standards Criteria and standards Example • Personal exposure standards radiation, (air?) • Ambient composition standards air, water • Product design standards seat belts, cars, gasoline • Product performance standards car exhaust, flammability of clothes • Work practice standards air traffic controller hours • Promotional claims standards truth in advertising? • Packaging standards Childproof pill bottles
Clean Air Act 109 b.1 • National primary ambient air quality standards, prescribed, under subsection (a) shall be ambient air quality standards the attainment and maintenance of which in the judgment of the Administrator, based on such criteria and allowing anadequate margin of safety, are requisite to protect the public health. Such primary standards may be revised in the same manner as promulgated. • Question: Does “Requisite to protect public health” mean no harm to anyone? If not, which “anyones” don’t we protect? • Question: How does “Adequate margin of safety” handle pollutants in which any amount produces some harm? • Question: What should California's position be to this federal mandate?
PM 10 PM 2.5 TSP
c Particulate Matter in the Atmospheric – the Atmospheric Aerosol • Total Suspended Particulate mass TSP • < 35 μm • Inhalable Aerosols PM10 • < 10 μm • Fine Aerosols PM2.5 • < 2.5 μm • Very fine aerosols, < 0.25 μm, ultra fine aerosols, < 0.10 μm • 35 to 10 μm, mostly natural • Dust, sea salt, pollen, … • 10 to 2.5 μm, largely natural • Dust, sea spray, some nitrates • 2.5 to 0.25 μm, mostly man made • Fine dust, nitrates, sulfates, organics, smoke • 0.25 to circa 0.01 μm, almost entirely man made; • high temperature combustion, heavy organics, soot, metals 0.25 μm 2.5 μm
Total Suspended Particulate mass TSP < 35 μm Inhalable Aerosols PM10 < 10 μm Fine Aerosols PM2.5 < 2.5 μm Very fine aerosols, < 0.25 μm, ultra fine aerosols, < 0.10 μm 35 to 10 μm, mostly natural Dust, sea salt, pollen, … 10 to 2.5 μm, largely natural Dust, sea spray, some nitrates 2.5 to 0.25 μm, mostly man made Fine dust, nitrates, sulfates, organics, smoke 0.25 to circa 0.01 μm, almost entirely man made; high temperature combustion, heavy organics, soot, metals Particulate Matter in the Atmospheric – the Atmospheric Aerosol
Making of the EPA Fine Particle Standard “Those who like law or sausage should never watch either one being made” • CAASAC – 8 of the scientists said no new PM2.5 annual average standard was justified • Of the 13 who wanted a standard, 6 said science could not support a numerical standard • Of the 7 who supported a numerical standard, the choices ranged from 15 to 30 μg/m3 (average 22 μg/m3) • The EPA staff recommended a standard in the range from 20 μg/m3 to 12.5 μg/m3 • The EPA Administrator (in a room with 11 others, none of whom were scientists) chose 15 μg/m3
Fine particles – age the lung and heart Statistically, excellent connection between fine particles and health, including mortality Causally, most of fine particle mass is totally harmless even in massive doses…. • EPA’s current thinking: health effects caused by • Biological agents (fungi, bacteria, viruses, spores..) • Acidic aerosols • Fine metals such as iron in the lung • Insoluble very fine and ultra fine particles • High temperature organic matter
Visibility reduction is mostly caused by fine particles, < 1 m; sulfates, organics (smoke), soil, nitrates, soot, and sea salt PM 2.5 PM 10
Example #1: Lead and the California freeways • Data on human health effects of lead cause the California ARB to pass a standard - < 2.5 μg/m3 • These levels were thought to be violated near freeways in LA, many in low income areas • Research on ozone shows ARB that radical technology was needed to correct LA’s problem – the catalytic converter – on all new cars • But the catalytic converter, which makes CO into CO2 and HC into H2O and CO2, needs lead free gasoline • However, the catalytic converter also changes SO2 from the sulfur in gasoline into sulfuric acid
Effect of roadway distance and configuration on downwind concentrations of lead 1. 1 - per 10,000 v/hr
Reduction in ozone precursors in LA roughly tracks ozone decline
Los Angeles 1 hr Ozone Maximum Global background
Los Angeles Ozone 8 hr 4th Highest 3 yr Average Global background
Alameda County Ozone 8 hr 4th Highest 3 yr Average Global background
Fresno Ozone 8 hr 4th Highest 3 yr Average Global background
Total Suspended Particulate mass TSP < 35 μm Inhalable Aerosols PM10 < 10 μm Fine Aerosols PM2.5 < 2.5 μm Very fine aerosols, < 0.25 μm, ultra fine aerosols, < 0.10 μm 35 to 10 μm, mostly natural Dust, sea salt, pollen, … 10 to 2.5 μm, largely natural Dust, sea spray, some nitrates 2.5 to 0.25 μm, mostly man made Fine dust, nitrates, sulfates, organics, smoke 0.25 to circa 0.01 μm, almost entirely man made; high temperature combustion, heavy organics, soot, metals Particulate Matter in the Atmospheric – the Atmospheric Aerosol
PM 0.25 ? PM 10 PM 2.5
So what if Fresno in winter is Impacted by diesels and smoking cars ? “It is important to note that the estimated health risk from diesel particulate matter is higher than the risk from all other toxic air contaminants combined…. “In fact, the ARB estimates that 70 percent of the known statewide cancer risk from outdoor air toxics is attributable to diesel particulate matter”. “The ARB does not routinely monitor diesel particulate matter concentrations”. ARB Almanac 2001, pg. 346
Example #2: Yosemite NP, Navajo Power Station and Grand Canyon NP • CAA amendments of 1977 identified Grand Canyon NP as a “Class 1” area in which visibility had to be protected (to “close” to natural background) from human impact • If an anthropogenic plume were identified as impacting the park, NPS could request EPA for hearings on mandated mitigation • Navajo Power station in Page, AZ, was a large coal fired power plant with no SO2 controls located 18 miles from the east end of the park. • The NPS wanted this cleaned up! I was in charge of the aerosol science
Visibility reduction is mostly caused by fine particles, < 1 m; sulfates, organics (smoke), soil, nitrates, soot, and sea salt
Informational Resources for this Talk • San Joaquin Valley Unified Air Quality Management District • http://www.valleyair.org • California Air Resources Board - Almanac of Emissions and Air Quality and http://www.arb.ca.gov/html/aqe&m.htm • Routine monitoring – ADAM http://www.arb.ca.gov/adam • Special Studies - CRAPAQS, FACES, …. • US Environmental Protection Agency • Routine monitoring – AIRS data base • Special studies – Fresno Super-site, • US Interagency Monitoring for Protected Visual Environments (IMPROVE) – Yosemite and Sequoia NP • Routine monitoring – http://vista.cira.colostate.edu/improve/ • Special studies – Yosemite Study, summer, 2002 • Research Projects – • Universities – UC Davis http://delta.ucdavis.edu(I’ll post this talk) FACES, UN Reno Desert Research Inst., CORE http://nurseweb.ucsf.edu/iha/core.htm • Non Governmental Organizations – ALASET HETF, Valley Health Study and Sacramento/I-5 Transect Study; HEI www.healtheffects.org • Federal resources NOAA HYSPLIThttp://www.arl.noaa.gov/ready/hysplit4.html